Compare commits
214 Commits
| Author | SHA1 | Date | |
|---|---|---|---|
|
|
39a3898234 | ||
|
|
9372cf9f18 | ||
|
|
41e427d645 | ||
|
|
84ff6f7e89 | ||
|
|
a286625ad9 | ||
|
|
d7999e6627 | ||
|
|
41481c1ca8 | ||
|
|
e926486b0f | ||
|
|
3ad55c9750 | ||
|
|
06c4151ec4 | ||
|
|
51605d9e04 | ||
|
|
438b558809 | ||
|
|
293c44b2a5 | ||
|
|
55de241f48 | ||
|
|
fda1d32dec | ||
|
|
b8d5295690 | ||
|
|
fdc8dd8795 | ||
|
|
99b3775926 | ||
|
|
f0f44c9d35 | ||
|
|
d7b878f980 | ||
|
|
d8c8b90a95 | ||
|
|
8be3d82ae9 | ||
|
|
fd778be943 | ||
|
|
51936bdc89 | ||
|
|
2935fad54d | ||
|
|
c9257bdb99 | ||
|
|
90a6ace666 | ||
|
|
5eb2b5211c | ||
|
|
2ed9ddcdf8 | ||
|
|
92f4be79ac | ||
|
|
593f450093 | ||
|
|
d20efe4509 | ||
|
|
fcac992e71 | ||
|
|
d59663810c | ||
|
|
37abdbb774 | ||
|
|
a5909682cd | ||
|
|
927b4324ae | ||
|
|
1ae72dafca | ||
|
|
392865ec59 | ||
|
|
3f1af1ec85 | ||
|
|
487432d873 | ||
|
|
a1ff44454a | ||
|
|
05b0557430 | ||
|
|
975b84a2eb | ||
|
|
3e845f1a29 | ||
|
|
49a266c207 | ||
|
|
7284e55eb0 | ||
|
|
b82fd5e5a5 | ||
|
|
4b084cf685 | ||
|
|
e6c740d917 | ||
|
|
cb93a9a158 | ||
|
|
3ea65ea1ad | ||
|
|
70d91bb399 | ||
|
|
f5fa18d7ca | ||
|
|
cb24c74769 | ||
|
|
775dc91ede | ||
|
|
ffef8ba4d9 | ||
|
|
ef2df0d7bc | ||
|
|
f0bf5219d4 | ||
|
|
c8a1165db2 | ||
|
|
e9c3518ce7 | ||
|
|
a5ea6587c0 | ||
|
|
2792835d66 | ||
|
|
16867db1b4 | ||
|
|
164bbb884d | ||
|
|
873141b9ca | ||
|
|
4a66a28c01 | ||
|
|
c886c1db62 | ||
|
|
f2d121a13b | ||
|
|
f255938780 | ||
|
|
aa17367de7 | ||
|
|
d5df6df661 | ||
|
|
ec6004963c | ||
|
|
61d272dbbc | ||
|
|
6be97b3fc7 | ||
|
|
6f95275051 | ||
|
|
49829fc80f | ||
|
|
9112c5a064 | ||
|
|
73c4833697 | ||
|
|
f3ca6266ab | ||
|
|
03acb869b7 | ||
|
|
8470d728f9 | ||
|
|
71965b199b | ||
|
|
fd47d385c2 | ||
|
|
dfdd8cffd7 | ||
|
|
138c42ec3a | ||
|
|
e53723c9c2 | ||
|
|
03be6a58ac | ||
|
|
864f362f7d | ||
|
|
bfb329b2f3 | ||
|
|
4ce65be0c6 | ||
|
|
6ab598d71b | ||
|
|
06b8ab4096 | ||
|
|
596bb6487c | ||
|
|
fa33a3e4bb | ||
|
|
abecb891dd | ||
|
|
fa14cebbf4 | ||
|
|
bde24d28b7 | ||
|
|
c0b400eb7c | ||
|
|
4772c91835 | ||
|
|
6da8d919b3 | ||
|
|
10b5504446 | ||
|
|
76b73a6319 | ||
|
|
0bebfbbb23 | ||
|
|
8cb147920b | ||
|
|
5cb343d89f | ||
|
|
67f34f1b29 | ||
|
|
349d781085 | ||
|
|
d7524414ce | ||
|
|
2e6cccaa90 | ||
|
|
565b99e210 | ||
|
|
5eb37b8f76 | ||
|
|
41cb713367 | ||
|
|
b29fe1f13b | ||
|
|
339780dcc4 | ||
|
|
56c77085bf | ||
|
|
118cac5941 | ||
|
|
7027f18394 | ||
|
|
99a85205f0 | ||
|
|
4b8d8718c2 | ||
|
|
0c4dd94e38 | ||
|
|
52cec59ca3 | ||
|
|
2c1ba42bcc | ||
|
|
6d204b52ce | ||
|
|
55c3745ef8 | ||
|
|
c876f879de | ||
|
|
f2beab1fdc | ||
|
|
85af1abb26 | ||
|
|
4f54901d08 | ||
|
|
98b10866bf | ||
|
|
ccf4dc55e9 | ||
|
|
8ce90e1814 | ||
|
|
2b6047d124 | ||
|
|
05e832ed55 | ||
|
|
45fddab9a9 | ||
|
|
34e9c0da6b | ||
|
|
9891375c20 | ||
|
|
377f145a3f | ||
|
|
6c7fff080f | ||
|
|
b1a168c5f2 | ||
|
|
d15df9ae88 | ||
|
|
c7d93d9ca7 | ||
|
|
0ae4ccede1 | ||
|
|
c6aa66ab94 | ||
|
|
2e10d8bf05 | ||
|
|
f64295bcee | ||
|
|
3fe8119e0c | ||
|
|
b6880213ce | ||
|
|
aca6b2b558 | ||
|
|
aa33af25fc | ||
|
|
aa3a93da98 | ||
|
|
b42db67d85 | ||
|
|
0d2163cd94 | ||
|
|
371e177ff3 | ||
|
|
e62668ab48 | ||
|
|
005e3928e7 | ||
|
|
0d5b2a2277 | ||
|
|
bc8cfa91ee | ||
|
|
63b217faee | ||
|
|
376bf194b3 | ||
|
|
a69e9abf3c | ||
|
|
c22529bbd0 | ||
|
|
6fd8498f6d | ||
|
|
39cce0196f | ||
|
|
4e39e5608c | ||
|
|
ba4d16fd76 | ||
|
|
b9f14ee57a | ||
|
|
a3f791be17 | ||
|
|
41497c73f4 | ||
|
|
2e1b3fc8de | ||
|
|
44cf4d08e9 | ||
|
|
ca07b47523 | ||
|
|
8fceafc017 | ||
|
|
47dcf6a7b9 | ||
|
|
c63ec2d95d | ||
|
|
f4aeb98744 | ||
|
|
e6aefb8f4b | ||
|
|
6cf1f35eca | ||
|
|
cff742d7c4 | ||
|
|
67f8f414bf | ||
|
|
ecf73e967a | ||
|
|
7f8986a06d | ||
|
|
ec6aab2c8d | ||
|
|
b8625d5e1e | ||
|
|
0fa4654034 | ||
|
|
6349dbf5c0 | ||
|
|
c8cec8e18b | ||
|
|
70114e3fd3 | ||
|
|
cd75c5fa25 | ||
|
|
1535f7aa41 | ||
|
|
90abb7ba5b | ||
|
|
e6739711b0 | ||
|
|
333780e78b | ||
|
|
38777801de | ||
|
|
3750ed850c | ||
|
|
fda53fbf80 | ||
|
|
c8a472c01b | ||
|
|
ccd64a3df9 | ||
|
|
2ea13cec88 | ||
|
|
5afc800b11 | ||
|
|
1fb898ac22 | ||
|
|
73b7fc1cfc | ||
|
|
b25ff35e5b | ||
|
|
4fe4053cdd | ||
|
|
ed70160583 | ||
|
|
bb00f8cabd | ||
|
|
7bef999c41 | ||
|
|
a2774d92da | ||
|
|
be9b03d99b | ||
|
|
b4af9e5f32 | ||
|
|
3ba2762805 | ||
|
|
2884a80d31 | ||
|
|
54266acfb1 | ||
|
|
9cb44815c4 |
@@ -1,296 +0,0 @@
|
||||
version: 2.1
|
||||
jobs:
|
||||
|
||||
build-binary:
|
||||
docker:
|
||||
- image: circleci/golang:1.14
|
||||
working_directory: ~/build
|
||||
steps:
|
||||
- checkout
|
||||
- restore_cache:
|
||||
keys:
|
||||
- go-mod-v3-{{ checksum "go.sum" }}
|
||||
- run:
|
||||
name: Run go mod download
|
||||
command: go mod download
|
||||
- run:
|
||||
name: Check code formatting
|
||||
command: go install golang.org/x/tools/cmd/goimports && make test-fmt
|
||||
- run:
|
||||
name: Build Flagger
|
||||
command: |
|
||||
CGO_ENABLED=0 GOOS=linux go build \
|
||||
-ldflags "-s -w -X github.com/weaveworks/flagger/pkg/version.REVISION=${CIRCLE_SHA1}" \
|
||||
-a -installsuffix cgo -o bin/flagger ./cmd/flagger/*.go
|
||||
- run:
|
||||
name: Build Flagger load tester
|
||||
command: |
|
||||
CGO_ENABLED=0 GOOS=linux go build \
|
||||
-a -installsuffix cgo -o bin/loadtester ./cmd/loadtester/*.go
|
||||
- run:
|
||||
name: Run unit tests
|
||||
command: |
|
||||
go test -race -coverprofile=coverage.txt -covermode=atomic $(go list ./pkg/...)
|
||||
bash <(curl -s https://codecov.io/bash)
|
||||
- run:
|
||||
name: Verify code gen
|
||||
command: make test-codegen
|
||||
- save_cache:
|
||||
key: go-mod-v3-{{ checksum "go.sum" }}
|
||||
paths:
|
||||
- "/go/pkg/mod/"
|
||||
- persist_to_workspace:
|
||||
root: bin
|
||||
paths:
|
||||
- flagger
|
||||
- loadtester
|
||||
|
||||
push-container:
|
||||
docker:
|
||||
- image: circleci/golang:1.14
|
||||
steps:
|
||||
- checkout
|
||||
- setup_remote_docker:
|
||||
docker_layer_caching: true
|
||||
- attach_workspace:
|
||||
at: /tmp/bin
|
||||
- run: test/container-build.sh
|
||||
- run: test/container-push.sh
|
||||
|
||||
push-binary:
|
||||
docker:
|
||||
- image: circleci/golang:1.14
|
||||
working_directory: ~/build
|
||||
steps:
|
||||
- checkout
|
||||
- setup_remote_docker:
|
||||
docker_layer_caching: true
|
||||
- restore_cache:
|
||||
keys:
|
||||
- go-mod-v3-{{ checksum "go.sum" }}
|
||||
- run: make release-notes
|
||||
- run: github-release-notes -org weaveworks -repo flagger -since-latest-release -include-author > /tmp/release.txt
|
||||
- run: test/goreleaser.sh
|
||||
|
||||
e2e-kubernetes-testing:
|
||||
machine: true
|
||||
steps:
|
||||
- checkout
|
||||
- attach_workspace:
|
||||
at: /tmp/bin
|
||||
- run: test/container-build.sh
|
||||
- run: test/e2e-kind.sh v1.18.2
|
||||
- run: test/e2e-kubernetes.sh
|
||||
- run: test/e2e-kubernetes-tests-deployment.sh
|
||||
- run: test/e2e-kubernetes-cleanup.sh
|
||||
- run: test/e2e-kubernetes-tests-daemonset.sh
|
||||
|
||||
e2e-istio-testing:
|
||||
machine: true
|
||||
steps:
|
||||
- checkout
|
||||
- attach_workspace:
|
||||
at: /tmp/bin
|
||||
- run: test/container-build.sh
|
||||
- run: test/e2e-kind.sh v1.18.2
|
||||
- run: test/e2e-istio.sh
|
||||
- run: test/e2e-istio-dependencies.sh
|
||||
- run: test/e2e-istio-tests.sh
|
||||
- run: test/e2e-istio-tests-skip-analysis.sh
|
||||
- run: test/e2e-kubernetes-cleanup.sh
|
||||
- run: test/e2e-istio-dependencies.sh
|
||||
- run: test/e2e-istio-tests-delegate.sh
|
||||
|
||||
e2e-gloo-testing:
|
||||
machine: true
|
||||
steps:
|
||||
- checkout
|
||||
- attach_workspace:
|
||||
at: /tmp/bin
|
||||
- run: test/container-build.sh
|
||||
- run: test/e2e-kind.sh
|
||||
- run: test/e2e-gloo.sh
|
||||
- run: test/e2e-gloo-tests.sh
|
||||
|
||||
e2e-nginx-testing:
|
||||
machine: true
|
||||
steps:
|
||||
- checkout
|
||||
- attach_workspace:
|
||||
at: /tmp/bin
|
||||
- run: test/container-build.sh
|
||||
- run: test/e2e-kind.sh
|
||||
- run: test/e2e-nginx.sh
|
||||
- run: test/e2e-nginx-tests.sh
|
||||
- run: test/e2e-nginx-cleanup.sh
|
||||
- run: test/e2e-nginx-custom-annotations.sh
|
||||
- run: test/e2e-nginx-tests.sh
|
||||
|
||||
e2e-linkerd-testing:
|
||||
machine: true
|
||||
steps:
|
||||
- checkout
|
||||
- attach_workspace:
|
||||
at: /tmp/bin
|
||||
- run: test/container-build.sh
|
||||
- run: test/e2e-kind.sh
|
||||
- run: test/e2e-linkerd.sh
|
||||
- run: test/e2e-linkerd-tests.sh
|
||||
|
||||
e2e-contour-testing:
|
||||
machine: true
|
||||
steps:
|
||||
- checkout
|
||||
- attach_workspace:
|
||||
at: /tmp/bin
|
||||
- run: test/container-build.sh
|
||||
- run: test/e2e-kind.sh
|
||||
- run: test/e2e-contour.sh
|
||||
- run: test/e2e-contour-tests.sh
|
||||
|
||||
e2e-skipper-testing:
|
||||
machine: true
|
||||
steps:
|
||||
- checkout
|
||||
- attach_workspace:
|
||||
at: /tmp/bin
|
||||
- run: test/container-build.sh
|
||||
- run: test/e2e-kind.sh
|
||||
- run: test/e2e-skipper.sh
|
||||
- run: test/e2e-skipper-tests.sh
|
||||
- run: test/e2e-skipper-cleanup.sh
|
||||
|
||||
e2e-traefik-testing:
|
||||
machine: true
|
||||
steps:
|
||||
- checkout
|
||||
- attach_workspace:
|
||||
at: /tmp/bin
|
||||
- run: test/container-build.sh
|
||||
- run: test/e2e-kind.sh
|
||||
- run: test/e2e-traefik.sh
|
||||
- run: test/e2e-traefik-tests.sh
|
||||
- run: test/e2e-skipper-cleanup.sh
|
||||
|
||||
push-helm-charts:
|
||||
docker:
|
||||
- image: circleci/golang:1.14
|
||||
steps:
|
||||
- checkout
|
||||
- run:
|
||||
name: Install kubectl
|
||||
command: sudo curl -L https://storage.googleapis.com/kubernetes-release/release/$(curl -s https://storage.googleapis.com/kubernetes-release/release/stable.txt)/bin/linux/amd64/kubectl -o /usr/local/bin/kubectl && sudo chmod +x /usr/local/bin/kubectl
|
||||
- run:
|
||||
name: Install helm
|
||||
command: sudo curl -L https://storage.googleapis.com/kubernetes-helm/helm-v2.14.2-linux-amd64.tar.gz | tar xz && sudo mv linux-amd64/helm /bin/helm && sudo rm -rf linux-amd64
|
||||
- run:
|
||||
name: Initialize helm
|
||||
command: helm init --client-only --kubeconfig=$HOME/.kube/kubeconfig
|
||||
- run:
|
||||
name: Lint charts
|
||||
command: |
|
||||
helm lint ./charts/*
|
||||
- run:
|
||||
name: Package charts
|
||||
command: |
|
||||
mkdir $HOME/charts
|
||||
helm package ./charts/* --destination $HOME/charts
|
||||
- run:
|
||||
name: Publish charts
|
||||
command: |
|
||||
if echo "${CIRCLE_TAG}" | grep v; then
|
||||
REPOSITORY="https://weaveworksbot:${GITHUB_TOKEN}@github.com/weaveworks/flagger.git"
|
||||
git config user.email weaveworksbot@users.noreply.github.com
|
||||
git config user.name weaveworksbot
|
||||
git remote set-url origin ${REPOSITORY}
|
||||
git checkout gh-pages
|
||||
mv -f $HOME/charts/*.tgz .
|
||||
helm repo index . --url https://flagger.app
|
||||
git add .
|
||||
git commit -m "Publish Helm charts v${CIRCLE_TAG}"
|
||||
git push origin gh-pages
|
||||
else
|
||||
echo "Not a release! Skip charts publish"
|
||||
fi
|
||||
|
||||
workflows:
|
||||
version: 2
|
||||
build-test-push:
|
||||
jobs:
|
||||
- build-binary:
|
||||
filters:
|
||||
branches:
|
||||
ignore:
|
||||
- gh-pages
|
||||
- /^user-.*/
|
||||
- e2e-kubernetes-testing:
|
||||
requires:
|
||||
- build-binary
|
||||
- e2e-istio-testing:
|
||||
requires:
|
||||
- build-binary
|
||||
- e2e-gloo-testing:
|
||||
requires:
|
||||
- build-binary
|
||||
- e2e-nginx-testing:
|
||||
requires:
|
||||
- build-binary
|
||||
- e2e-linkerd-testing:
|
||||
requires:
|
||||
- build-binary
|
||||
- e2e-contour-testing:
|
||||
requires:
|
||||
- build-binary
|
||||
- e2e-skipper-testing:
|
||||
requires:
|
||||
- build-binary
|
||||
- e2e-traefik-testing:
|
||||
requires:
|
||||
- build-binary
|
||||
- push-container:
|
||||
requires:
|
||||
- build-binary
|
||||
- e2e-kubernetes-testing
|
||||
- e2e-istio-testing
|
||||
- e2e-gloo-testing
|
||||
- e2e-nginx-testing
|
||||
- e2e-linkerd-testing
|
||||
- e2e-skipper-testing
|
||||
- e2e-traefik-testing
|
||||
filters:
|
||||
branches:
|
||||
only:
|
||||
- master
|
||||
|
||||
release:
|
||||
jobs:
|
||||
- build-binary:
|
||||
filters:
|
||||
branches:
|
||||
ignore: /.*/
|
||||
tags:
|
||||
ignore: /^chart.*/
|
||||
- push-container:
|
||||
requires:
|
||||
- build-binary
|
||||
filters:
|
||||
branches:
|
||||
ignore: /.*/
|
||||
tags:
|
||||
ignore: /^chart.*/
|
||||
- push-binary:
|
||||
requires:
|
||||
- push-container
|
||||
filters:
|
||||
branches:
|
||||
ignore: /.*/
|
||||
tags:
|
||||
ignore: /^chart.*/
|
||||
- push-helm-charts:
|
||||
requires:
|
||||
- push-container
|
||||
filters:
|
||||
branches:
|
||||
ignore: /.*/
|
||||
tags:
|
||||
ignore: /^chart.*/
|
||||
29
.github/ISSUE_TEMPLATE/bug_report.md
vendored
Normal file
@@ -0,0 +1,29 @@
|
||||
---
|
||||
name: Bug report
|
||||
about: Create a report to help us improve this project
|
||||
title: ''
|
||||
assignees: ''
|
||||
|
||||
---
|
||||
|
||||
### Describe the bug
|
||||
|
||||
A clear and concise description of what the bug is.
|
||||
Please provide the Canary definition and Flagger logs.
|
||||
|
||||
### To Reproduce
|
||||
|
||||
<!--
|
||||
Steps to reproduce the behaviour
|
||||
-->
|
||||
|
||||
### Expected behavior
|
||||
|
||||
A clear and concise description of what you expected to happen.
|
||||
|
||||
### Additional context
|
||||
|
||||
- Flagger version:
|
||||
- Kubernetes version:
|
||||
- Service Mesh provider:
|
||||
- Ingress provider:
|
||||
2
.github/ISSUE_TEMPLATE/config.yml
vendored
Normal file
@@ -0,0 +1,2 @@
|
||||
blank_issues_enabled: true
|
||||
|
||||
19
.github/ISSUE_TEMPLATE/feature_request.md
vendored
Normal file
@@ -0,0 +1,19 @@
|
||||
---
|
||||
name: Feature Request
|
||||
about: I have a suggestion (and may want to implement it 🙂)!
|
||||
title: ''
|
||||
assignees: ''
|
||||
|
||||
---
|
||||
|
||||
## Describe the feature
|
||||
|
||||
What problem are you trying to solve?
|
||||
|
||||
### Proposed solution
|
||||
|
||||
What do you want to happen? Add any considered drawbacks.
|
||||
|
||||
### Any alternatives you've considered?
|
||||
|
||||
Is there another way to solve this problem that isn't as good a solution?
|
||||
17
.github/_main.workflow
vendored
@@ -1,17 +0,0 @@
|
||||
workflow "Publish Helm charts" {
|
||||
on = "push"
|
||||
resolves = ["helm-push"]
|
||||
}
|
||||
|
||||
action "helm-lint" {
|
||||
uses = "stefanprodan/gh-actions/helm@master"
|
||||
args = ["lint charts/*"]
|
||||
}
|
||||
|
||||
action "helm-push" {
|
||||
needs = ["helm-lint"]
|
||||
uses = "stefanprodan/gh-actions/helm-gh-pages@master"
|
||||
args = ["charts/*","https://flagger.app"]
|
||||
secrets = ["GITHUB_TOKEN"]
|
||||
}
|
||||
|
||||
49
.github/workflows/build.yaml
vendored
Normal file
@@ -0,0 +1,49 @@
|
||||
name: build
|
||||
|
||||
on:
|
||||
workflow_dispatch:
|
||||
pull_request:
|
||||
branches:
|
||||
- main
|
||||
push:
|
||||
branches:
|
||||
- main
|
||||
|
||||
jobs:
|
||||
container:
|
||||
runs-on: ubuntu-latest
|
||||
steps:
|
||||
- name: Checkout
|
||||
uses: actions/checkout@v2
|
||||
- name: Restore Go cache
|
||||
uses: actions/cache@v1
|
||||
with:
|
||||
path: ~/go/pkg/mod
|
||||
key: ${{ runner.os }}-go-${{ hashFiles('**/go.sum') }}
|
||||
restore-keys: |
|
||||
${{ runner.os }}-go-
|
||||
- name: Setup Go
|
||||
uses: actions/setup-go@v2
|
||||
with:
|
||||
go-version: 1.15.x
|
||||
- name: Download modules
|
||||
run: |
|
||||
go mod download
|
||||
go install golang.org/x/tools/cmd/goimports
|
||||
- name: Run linters
|
||||
run: make test-fmt test-codegen
|
||||
- name: Run tests
|
||||
run: go test -race -coverprofile=coverage.txt -covermode=atomic $(go list ./pkg/...)
|
||||
- name: Check if working tree is dirty
|
||||
run: |
|
||||
if [[ $(git diff --stat) != '' ]]; then
|
||||
git --no-pager diff
|
||||
echo 'run make test and commit changes'
|
||||
exit 1
|
||||
fi
|
||||
- name: Upload coverage to Codecov
|
||||
uses: codecov/codecov-action@v1
|
||||
with:
|
||||
file: ./coverage.txt
|
||||
- name: Build container image
|
||||
run: docker build -t test/flagger:latest .
|
||||
37
.github/workflows/e2e.yaml
vendored
Normal file
@@ -0,0 +1,37 @@
|
||||
name: e2e
|
||||
|
||||
on:
|
||||
workflow_dispatch:
|
||||
pull_request:
|
||||
branches:
|
||||
- main
|
||||
push:
|
||||
branches:
|
||||
- main
|
||||
|
||||
jobs:
|
||||
kind:
|
||||
runs-on: ubuntu-latest
|
||||
strategy:
|
||||
matrix:
|
||||
provider:
|
||||
- istio
|
||||
- linkerd
|
||||
- contour
|
||||
- nginx
|
||||
- traefik
|
||||
- gloo
|
||||
- skipper
|
||||
- kubernetes
|
||||
steps:
|
||||
- name: Checkout
|
||||
uses: actions/checkout@v2
|
||||
- name: Setup Kubernetes
|
||||
uses: engineerd/setup-kind@v0.5.0
|
||||
- name: Build container image
|
||||
run: |
|
||||
docker build -t test/flagger:latest .
|
||||
kind load docker-image test/flagger:latest
|
||||
- name: Run tests
|
||||
run: |
|
||||
./test/${{ matrix['provider'] }}/run.sh
|
||||
74
.github/workflows/release.yml
vendored
Normal file
@@ -0,0 +1,74 @@
|
||||
name: release
|
||||
on:
|
||||
push:
|
||||
tags:
|
||||
- 'v*'
|
||||
|
||||
jobs:
|
||||
build-push:
|
||||
runs-on: ubuntu-latest
|
||||
steps:
|
||||
- uses: actions/checkout@v2
|
||||
- name: Prepare
|
||||
id: prep
|
||||
run: |
|
||||
VERSION=$(grep 'VERSION' pkg/version/version.go | awk '{ print $4 }' | tr -d '"')
|
||||
CHANGELOG="https://github.com/fluxcd/flagger/blob/main/CHANGELOG.md#$(echo $VERSION | tr -d '.')"
|
||||
echo ::set-output name=BUILD_DATE::$(date -u +'%Y-%m-%dT%H:%M:%SZ')
|
||||
echo ::set-output name=VERSION::${VERSION}
|
||||
echo ::set-output name=CHANGELOG::${CHANGELOG}
|
||||
- name: Setup QEMU
|
||||
uses: docker/setup-qemu-action@v1
|
||||
with:
|
||||
platforms: all
|
||||
- name: Setup Docker Buildx
|
||||
id: buildx
|
||||
uses: docker/setup-buildx-action@v1
|
||||
with:
|
||||
buildkitd-flags: "--debug"
|
||||
- name: Login to GitHub Container Registry
|
||||
uses: docker/login-action@v1
|
||||
with:
|
||||
registry: ghcr.io
|
||||
username: fluxcdbot
|
||||
password: ${{ secrets.GHCR_TOKEN }}
|
||||
- name: Publish image
|
||||
uses: docker/build-push-action@v2
|
||||
with:
|
||||
push: true
|
||||
builder: ${{ steps.buildx.outputs.name }}
|
||||
context: .
|
||||
file: ./Dockerfile
|
||||
platforms: linux/amd64,linux/arm64,linux/arm/v7
|
||||
build-args: |
|
||||
REVISON=${{ github.sha }}
|
||||
tags: |
|
||||
ghcr.io/fluxcd/flagger:${{ steps.prep.outputs.VERSION }}
|
||||
labels: |
|
||||
org.opencontainers.image.title=${{ github.event.repository.name }}
|
||||
org.opencontainers.image.description=${{ github.event.repository.description }}
|
||||
org.opencontainers.image.url=${{ github.event.repository.html_url }}
|
||||
org.opencontainers.image.source=${{ github.event.repository.html_url }}
|
||||
org.opencontainers.image.revision=${{ github.sha }}
|
||||
org.opencontainers.image.version=${{ steps.prep.outputs.VERSION }}
|
||||
org.opencontainers.image.created=${{ steps.prep.outputs.BUILD_DATE }}
|
||||
- name: Check images
|
||||
run: |
|
||||
docker buildx imagetools inspect ghcr.io/fluxcd/flagger:${{ steps.prep.outputs.VERSION }}
|
||||
- name: Publish Helm charts
|
||||
uses: stefanprodan/helm-gh-pages@v1.3.0
|
||||
with:
|
||||
token: ${{ secrets.GITHUB_TOKEN }}
|
||||
charts_url: https://flagger.app
|
||||
linting: off
|
||||
- name: Create release
|
||||
uses: actions/create-release@latest
|
||||
env:
|
||||
GITHUB_TOKEN: ${{ secrets.GITHUB_TOKEN }}
|
||||
with:
|
||||
tag_name: ${{ github.ref }}
|
||||
release_name: ${{ github.ref }}
|
||||
draft: false
|
||||
prerelease: false
|
||||
body: |
|
||||
[CHANGELOG](${{ steps.prep.outputs.CHANGELOG }})
|
||||
37
.github/workflows/scan.yml
vendored
Normal file
@@ -0,0 +1,37 @@
|
||||
name: scan
|
||||
|
||||
on:
|
||||
push:
|
||||
branches: [ main ]
|
||||
pull_request:
|
||||
branches: [ main ]
|
||||
schedule:
|
||||
- cron: '18 10 * * 3'
|
||||
|
||||
jobs:
|
||||
fossa:
|
||||
name: FOSSA
|
||||
runs-on: ubuntu-latest
|
||||
steps:
|
||||
- uses: actions/checkout@v2
|
||||
- name: Run FOSSA scan and upload build data
|
||||
uses: fossa-contrib/fossa-action@v1
|
||||
with:
|
||||
# FOSSA Push-Only API Token
|
||||
fossa-api-key: 5ee8bf422db1471e0bcf2bcb289185de
|
||||
github-token: ${{ github.token }}
|
||||
|
||||
codeql:
|
||||
name: CodeQL
|
||||
runs-on: ubuntu-latest
|
||||
steps:
|
||||
- name: Checkout repository
|
||||
uses: actions/checkout@v2
|
||||
- name: Initialize CodeQL
|
||||
uses: github/codeql-action/init@v1
|
||||
with:
|
||||
languages: go
|
||||
- name: Autobuild
|
||||
uses: github/codeql-action/autobuild@v1
|
||||
- name: Perform CodeQL Analysis
|
||||
uses: github/codeql-action/analyze@v1
|
||||
1
.gitignore
vendored
@@ -20,3 +20,4 @@ artifacts/gcloud/
|
||||
Makefile.dev
|
||||
|
||||
vendor
|
||||
coverage.txt
|
||||
|
||||
@@ -1,7 +1,7 @@
|
||||
builds:
|
||||
- main: ./cmd/flagger
|
||||
binary: flagger
|
||||
ldflags: -s -w -X github.com/weaveworks/flagger/pkg/version.REVISION={{.Commit}}
|
||||
ldflags: -s -w -X github.com/fluxcd/flagger/pkg/version.REVISION={{.Commit}}
|
||||
goos:
|
||||
- linux
|
||||
goarch:
|
||||
@@ -12,7 +12,3 @@ archives:
|
||||
- name_template: "{{ .Binary }}_{{ .Version }}_{{ .Os }}_{{ .Arch }}"
|
||||
files:
|
||||
- none*
|
||||
changelog:
|
||||
filters:
|
||||
exclude:
|
||||
- '^CircleCI'
|
||||
|
||||
619
CHANGELOG.md
3
CODE_OF_CONDUCT.md
Normal file
@@ -0,0 +1,3 @@
|
||||
## Code of Conduct
|
||||
|
||||
Flagger follows the [CNCF Code of Conduct](https://github.com/cncf/foundation/blob/master/code-of-conduct.md).
|
||||
@@ -14,10 +14,28 @@ Origin (DCO). This document was created by the Linux Kernel community and is a
|
||||
simple statement that you, as a contributor, have the legal right to make the
|
||||
contribution.
|
||||
|
||||
## Chat
|
||||
We require all commits to be signed. By signing off with your signature, you
|
||||
certify that you wrote the patch or otherwise have the right to contribute the
|
||||
material by the rules of the [DCO](DCO):
|
||||
|
||||
`Signed-off-by: Jane Doe <jane.doe@example.com>`
|
||||
|
||||
The signature must contain your real name
|
||||
(sorry, no pseudonyms or anonymous contributions)
|
||||
If your `user.name` and `user.email` are configured in your Git config,
|
||||
you can sign your commit automatically with `git commit -s`.
|
||||
|
||||
## Communications
|
||||
|
||||
The project uses Slack: To join the conversation, simply join the
|
||||
[Weave community](https://slack.weave.works/) Slack workspace #flagger channel.
|
||||
[CNCF](https://slack.cncf.io/) Slack workspace and use the
|
||||
[#flagger](https://cloud-native.slack.com/messages/flagger/) channel.
|
||||
|
||||
The developers use a mailing list to discuss development as well.
|
||||
Simply subscribe to [flux-dev on cncf.io](https://lists.cncf.io/g/cncf-flux-dev)
|
||||
to join the conversation (this will also add an invitation to your
|
||||
Google calendar for our [Flux
|
||||
meeting](https://docs.google.com/document/d/1l_M0om0qUEN_NNiGgpqJ2tvsF2iioHkaARDeh6b70B0/edit#)).
|
||||
|
||||
## Getting Started
|
||||
|
||||
@@ -69,4 +87,3 @@ For Flagger we prefer the following rules for good commit messages:
|
||||
The [following article](https://chris.beams.io/posts/git-commit/#seven-rules)
|
||||
has some more helpful advice on documenting your work.
|
||||
|
||||
This doc is adapted from [FluxCD](https://github.com/fluxcd/flux/blob/master/CONTRIBUTING.md).
|
||||
|
||||
36
DCO
Normal file
@@ -0,0 +1,36 @@
|
||||
Developer Certificate of Origin
|
||||
Version 1.1
|
||||
|
||||
Copyright (C) 2004, 2006 The Linux Foundation and its contributors.
|
||||
660 York Street, Suite 102,
|
||||
San Francisco, CA 94110 USA
|
||||
|
||||
Everyone is permitted to copy and distribute verbatim copies of this
|
||||
license document, but changing it is not allowed.
|
||||
|
||||
|
||||
Developer's Certificate of Origin 1.1
|
||||
|
||||
By making a contribution to this project, I certify that:
|
||||
|
||||
(a) The contribution was created in whole or in part by me and I
|
||||
have the right to submit it under the open source license
|
||||
indicated in the file; or
|
||||
|
||||
(b) The contribution is based upon previous work that, to the best
|
||||
of my knowledge, is covered under an appropriate open source
|
||||
license and I have the right under that license to submit that
|
||||
work with modifications, whether created in whole or in part
|
||||
by me, under the same open source license (unless I am
|
||||
permitted to submit under a different license), as indicated
|
||||
in the file; or
|
||||
|
||||
(c) The contribution was provided directly to me by some other
|
||||
person who certified (a), (b) or (c) and I have not modified
|
||||
it.
|
||||
|
||||
(d) I understand and agree that this project and the contribution
|
||||
are public and that a record of the contribution (including all
|
||||
personal information I submit with it, including my sign-off) is
|
||||
maintained indefinitely and may be redistributed consistent with
|
||||
this project or the open source license(s) involved.
|
||||
27
Dockerfile
@@ -1,9 +1,32 @@
|
||||
FROM alpine:3.12
|
||||
FROM golang:1.15-alpine as builder
|
||||
|
||||
ARG TARGETPLATFORM
|
||||
ARG REVISON
|
||||
|
||||
WORKDIR /workspace
|
||||
|
||||
# copy modules manifests
|
||||
COPY go.mod go.mod
|
||||
COPY go.sum go.sum
|
||||
|
||||
# cache modules
|
||||
RUN go mod download
|
||||
|
||||
# copy source code
|
||||
COPY cmd/ cmd/
|
||||
COPY pkg/ pkg/
|
||||
|
||||
# build
|
||||
RUN CGO_ENABLED=0 go build \
|
||||
-ldflags "-s -w -X github.com/fluxcd/flagger/pkg/version.REVISION=${REVISON}" \
|
||||
-a -o flagger ./cmd/flagger
|
||||
|
||||
FROM alpine:3.13
|
||||
|
||||
RUN apk --no-cache add ca-certificates
|
||||
|
||||
USER nobody
|
||||
|
||||
COPY --chown=nobody:nobody /bin/flagger .
|
||||
COPY --from=builder --chown=nobody:nobody /workspace/flagger .
|
||||
|
||||
ENTRYPOINT ["./flagger"]
|
||||
|
||||
2
LICENSE
@@ -186,7 +186,7 @@
|
||||
same "printed page" as the copyright notice for easier
|
||||
identification within third-party archives.
|
||||
|
||||
Copyright 2018 Weaveworks. All rights reserved.
|
||||
Copyright [yyyy] [name of copyright owner]
|
||||
|
||||
Licensed under the Apache License, Version 2.0 (the "License");
|
||||
you may not use this file except in compliance with the License.
|
||||
|
||||
@@ -1,6 +1,6 @@
|
||||
The maintainers are generally available in Slack at
|
||||
https://weave-community.slack.com/messages/flagger/ (obtain an invitation
|
||||
at https://slack.weave.works/).
|
||||
https://cloud-native.slack.com/messages/flagger/ (obtain an invitation
|
||||
at https://slack.cncf.io/).
|
||||
|
||||
Stefan Prodan, Weaveworks <stefan@weave.works> (Slack: @stefan Twitter: @stefanprodan)
|
||||
Takeshi Yoneda, DMM.com <cz.rk.t0415y.g@gmail.com> (Slack: @mathetake Twitter: @mathetake)
|
||||
|
||||
17
Makefile
@@ -3,14 +3,7 @@ VERSION?=$(shell grep 'VERSION' pkg/version/version.go | awk '{ print $$4 }' | t
|
||||
LT_VERSION?=$(shell grep 'VERSION' cmd/loadtester/main.go | awk '{ print $$4 }' | tr -d '"' | head -n1)
|
||||
|
||||
build:
|
||||
GIT_COMMIT=$$(git rev-list -1 HEAD) && CGO_ENABLED=0 GOOS=linux go build \
|
||||
-ldflags "-s -w -X github.com/weaveworks/flagger/pkg/version.REVISION=$${GIT_COMMIT}" \
|
||||
-a -installsuffix cgo -o ./bin/flagger ./cmd/flagger/*
|
||||
docker build -t weaveworks/flagger:$(TAG) . -f Dockerfile
|
||||
|
||||
push:
|
||||
docker tag weaveworks/flagger:$(TAG) weaveworks/flagger:$(VERSION)
|
||||
docker push weaveworks/flagger:$(VERSION)
|
||||
CGO_ENABLED=0 go build -a -o ./bin/flagger ./cmd/flagger
|
||||
|
||||
fmt:
|
||||
gofmt -l -s -w ./
|
||||
@@ -48,13 +41,9 @@ release:
|
||||
git tag "v$(VERSION)"
|
||||
git push origin "v$(VERSION)"
|
||||
|
||||
release-notes:
|
||||
cd /tmp && GH_REL_URL="https://github.com/buchanae/github-release-notes/releases/download/0.2.0/github-release-notes-linux-amd64-0.2.0.tar.gz" && \
|
||||
curl -sSL $${GH_REL_URL} | tar xz && sudo mv github-release-notes /usr/local/bin/
|
||||
|
||||
loadtester-build:
|
||||
CGO_ENABLED=0 GOOS=linux go build -a -installsuffix cgo -o ./bin/loadtester ./cmd/loadtester/*
|
||||
docker build -t weaveworks/flagger-loadtester:$(LT_VERSION) . -f Dockerfile.loadtester
|
||||
docker build -t ghcr.io/fluxcd/flagger-loadtester:$(LT_VERSION) . -f Dockerfile.loadtester
|
||||
|
||||
loadtester-push:
|
||||
docker push weaveworks/flagger-loadtester:$(LT_VERSION)
|
||||
docker push ghcr.io/fluxcd/flagger-loadtester:$(LT_VERSION)
|
||||
|
||||
75
README.md
@@ -1,22 +1,26 @@
|
||||
# flagger
|
||||
|
||||
[](https://circleci.com/gh/weaveworks/flagger)
|
||||
[](https://goreportcard.com/report/github.com/weaveworks/flagger)
|
||||
[](https://codecov.io/gh/weaveworks/flagger)
|
||||
[](https://github.com/weaveworks/flagger/blob/master/LICENSE)
|
||||
[](https://github.com/weaveworks/flagger/releases)
|
||||
[](https://bestpractices.coreinfrastructure.org/projects/4783)
|
||||
[](https://github.com/fluxcd/flagger/actions)
|
||||
[](https://goreportcard.com/report/github.com/fluxcd/flagger)
|
||||
[](https://github.com/fluxcd/flagger/blob/main/LICENSE)
|
||||
[](https://github.com/fluxcd/flagger/releases)
|
||||
|
||||
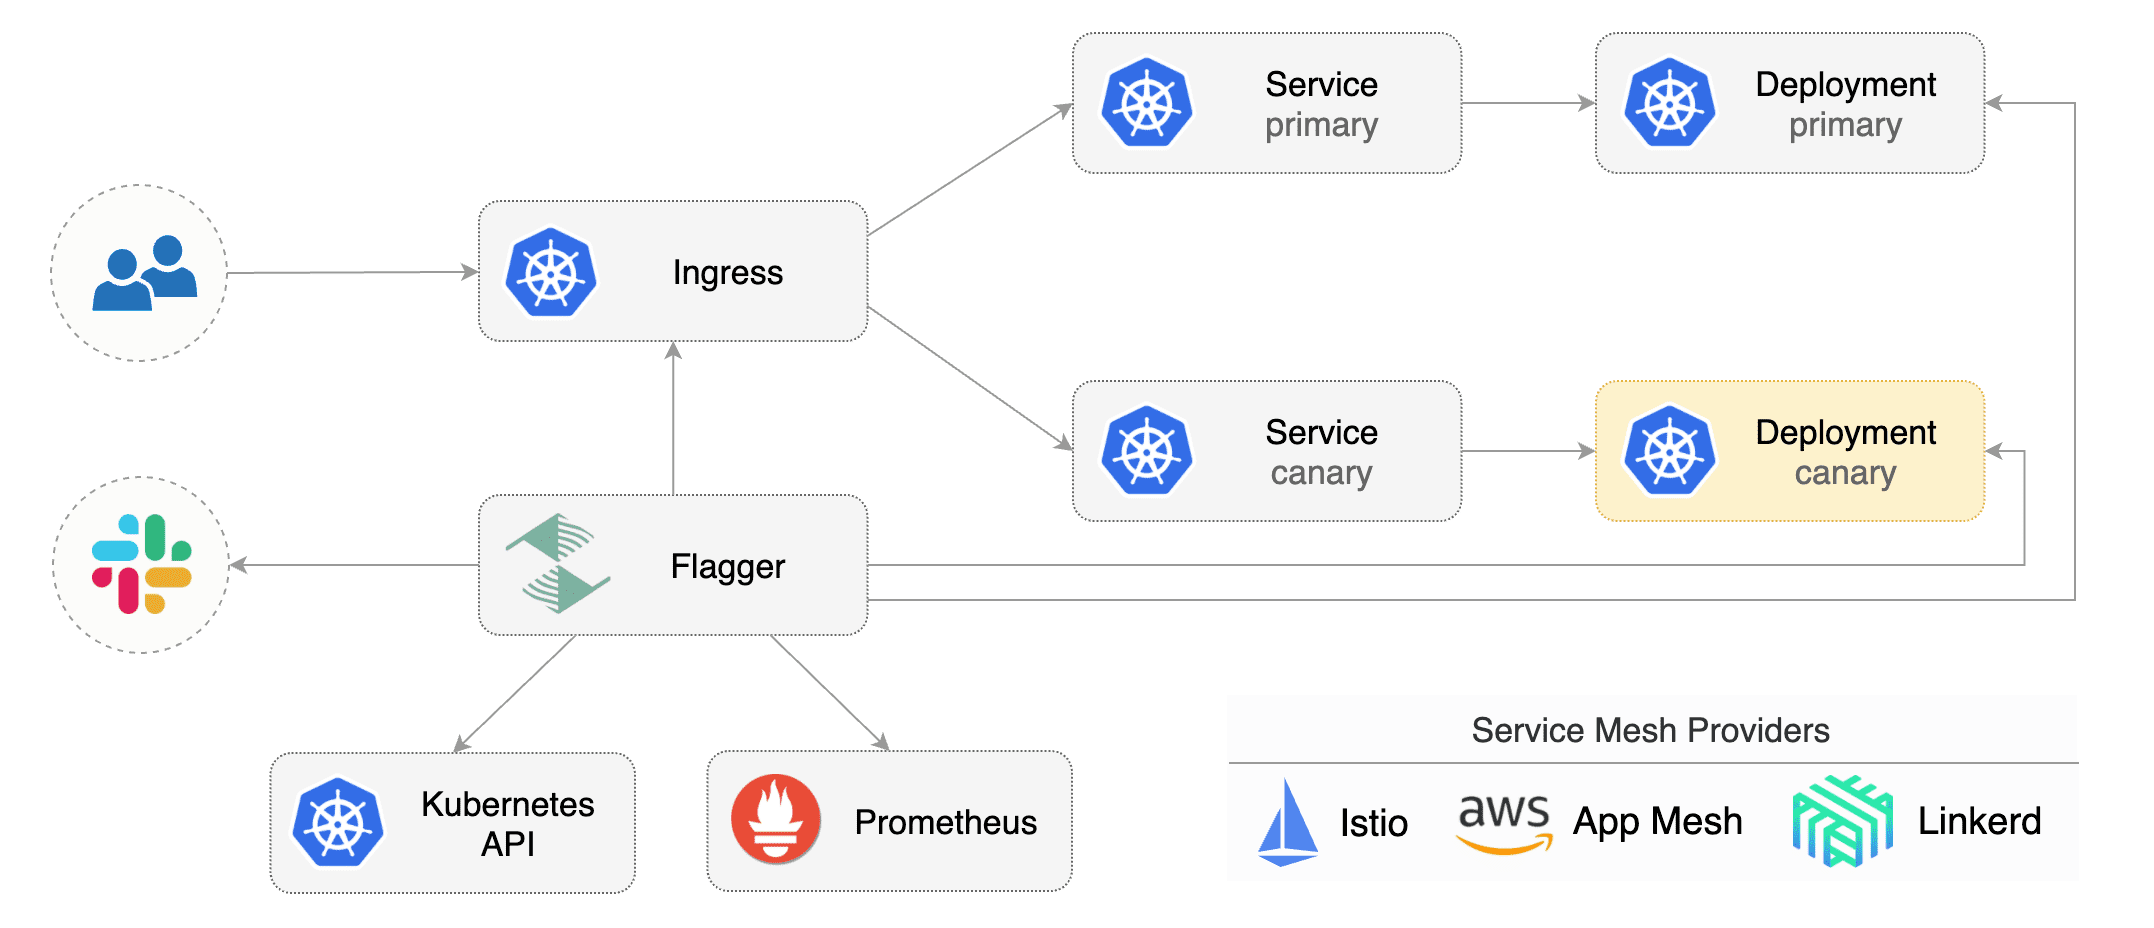
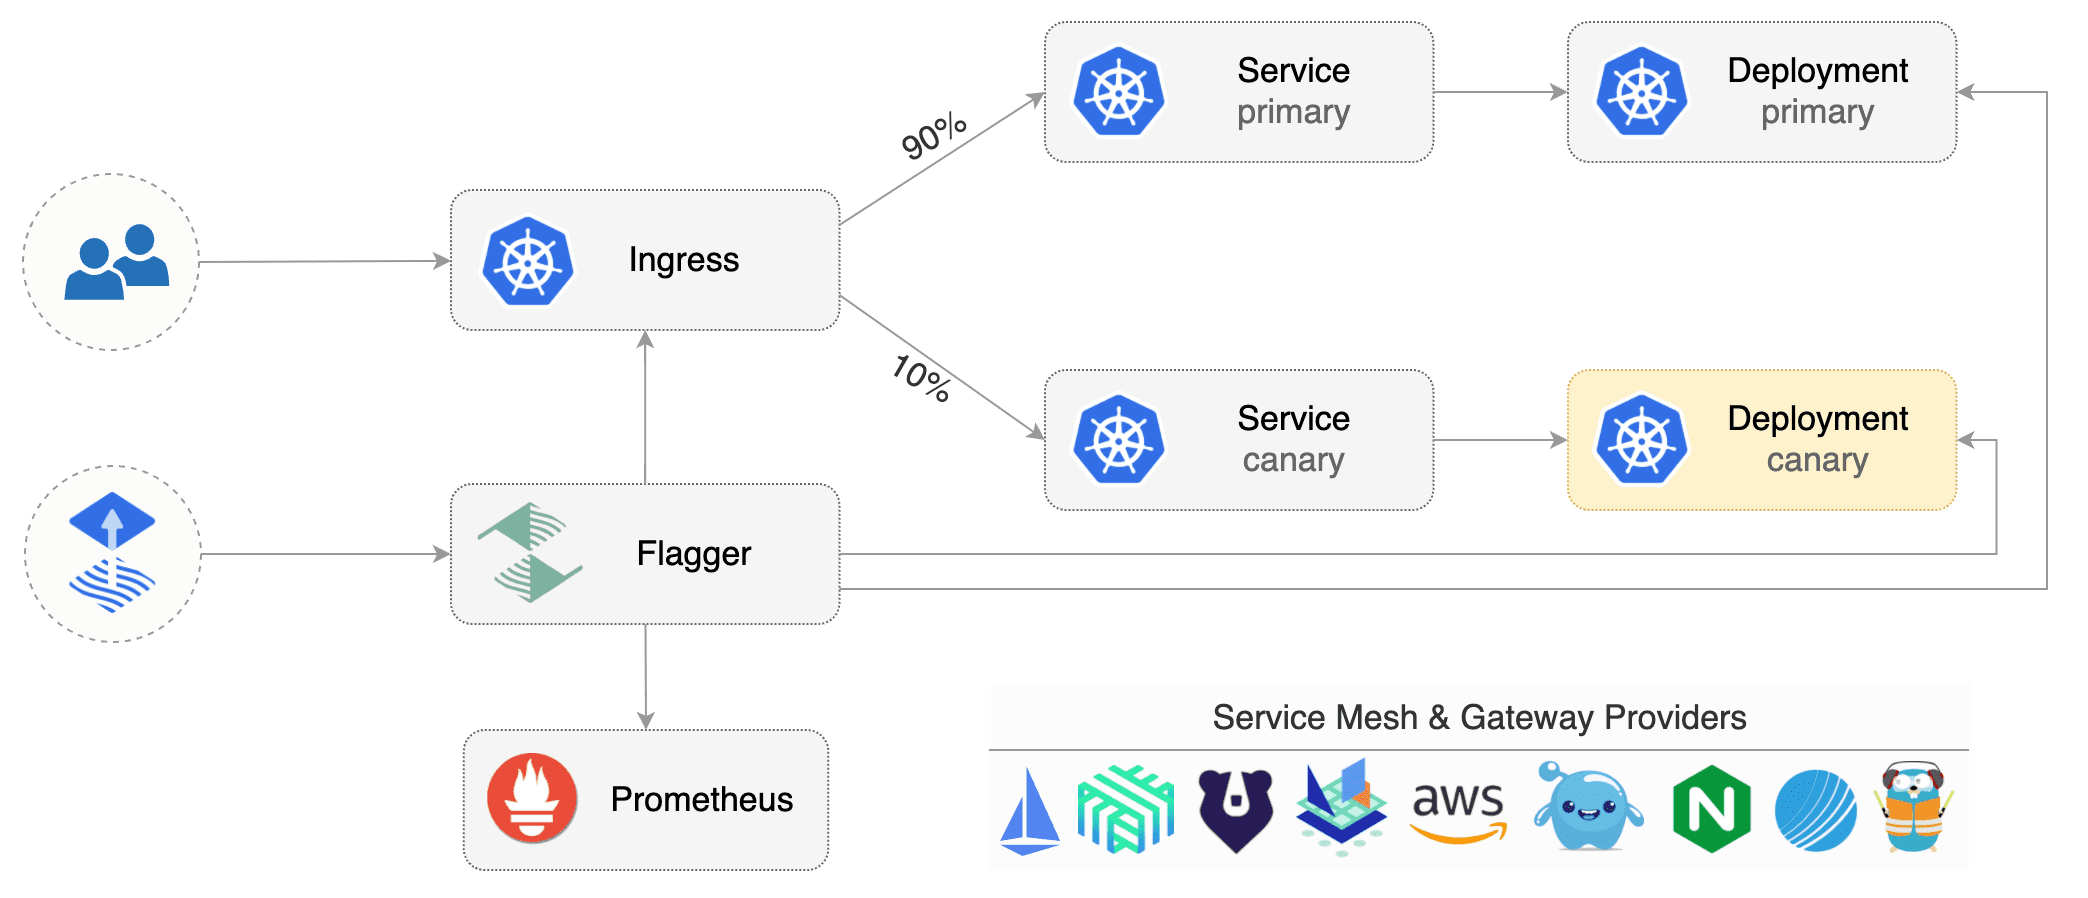
Flagger is a progressive delivery tool that automates the release process for applications running on Kubernetes.
|
||||
It reduces the risk of introducing a new software version in production
|
||||
by gradually shifting traffic to the new version while measuring metrics and running conformance tests.
|
||||
|
||||
|
||||
|
||||
|
||||
Flagger implements several deployment strategies (Canary releases, A/B testing, Blue/Green mirroring)
|
||||
using a service mesh (App Mesh, Istio, Linkerd) or an ingress controller (Contour, Gloo, NGINX, Skipper, Traefik) for traffic routing.
|
||||
For release analysis, Flagger can query Prometheus, Datadog or CloudWatch
|
||||
using a service mesh (App Mesh, Istio, Linkerd)
|
||||
or an ingress controller (Contour, Gloo, NGINX, Skipper, Traefik) for traffic routing.
|
||||
For release analysis, Flagger can query Prometheus, Datadog, New Relic or CloudWatch
|
||||
and for alerting it uses Slack, MS Teams, Discord and Rocket.
|
||||
|
||||
Flagger is a [Cloud Native Computing Foundation](https://cncf.io/) project
|
||||
and part of [Flux](https://fluxcd.io) family of GitOps tools.
|
||||
|
||||
### Documentation
|
||||
|
||||
Flagger documentation can be found at [docs.flagger.app](https://docs.flagger.app).
|
||||
@@ -43,17 +47,9 @@ Flagger documentation can be found at [docs.flagger.app](https://docs.flagger.ap
|
||||
|
||||
### Who is using Flagger
|
||||
|
||||
List of organizations using Flagger:
|
||||
**Our list of production users has moved to <https://fluxcd.io/adopters/#flagger>**.
|
||||
|
||||
* [Chick-fil-A](https://www.chick-fil-a.com)
|
||||
* [Capra Consulting](https://www.capraconsulting.no)
|
||||
* [DMM.com](https://dmm-corp.com)
|
||||
* [MediaMarktSaturn](https://www.mediamarktsaturn.com)
|
||||
* [Weaveworks](https://weave.works)
|
||||
* [Jumia Group](https://group.jumia.com)
|
||||
* [eLife](https://elifesciences.org/)
|
||||
|
||||
If you are using Flagger, please submit a PR to add your organization to the list!
|
||||
If you are using Flagger, please [submit a PR to add your organization](https://github.com/fluxcd/website/tree/main/adopters#readme) to the list!
|
||||
|
||||
### Canary CRD
|
||||
|
||||
@@ -75,6 +71,7 @@ metadata:
|
||||
spec:
|
||||
# service mesh provider (optional)
|
||||
# can be: kubernetes, istio, linkerd, appmesh, nginx, skipper, contour, gloo, supergloo, traefik
|
||||
# for SMI TrafficSplit can be: smi:v1alpha1, smi:v1alpha2, smi:v1alpha3
|
||||
provider: istio
|
||||
# deployment reference
|
||||
targetRef:
|
||||
@@ -185,24 +182,28 @@ For more details on how the canary analysis and promotion works please [read the
|
||||
|
||||
**Service Mesh**
|
||||
|
||||
| Feature | App Mesh | Istio | Linkerd | Kubernetes CNI |
|
||||
| ------------------------------------------ | ------------------ | ------------------ | ------------------ | ----------------- |
|
||||
| Canary deployments (weighted traffic) | :heavy_check_mark: | :heavy_check_mark: | :heavy_check_mark: | :heavy_minus_sign: |
|
||||
| A/B testing (headers and cookies routing) | :heavy_check_mark: | :heavy_check_mark: | :heavy_minus_sign: | :heavy_minus_sign: |
|
||||
| Blue/Green deployments (traffic switch) | :heavy_check_mark: | :heavy_check_mark: | :heavy_check_mark: | :heavy_check_mark: |
|
||||
| Blue/Green deployments (traffic mirroring) | :heavy_minus_sign: | :heavy_check_mark: | :heavy_minus_sign: | :heavy_minus_sign: |
|
||||
| Webhooks (acceptance/load testing) | :heavy_check_mark: | :heavy_check_mark: | :heavy_check_mark: | :heavy_check_mark: |
|
||||
| Manual gating (approve/pause/resume) | :heavy_check_mark: | :heavy_check_mark: | :heavy_check_mark: | :heavy_check_mark: |
|
||||
| Request success rate check (L7 metric) | :heavy_check_mark: | :heavy_check_mark: | :heavy_check_mark: | :heavy_minus_sign: |
|
||||
| Request duration check (L7 metric) | :heavy_check_mark: | :heavy_check_mark: | :heavy_check_mark: | :heavy_minus_sign: |
|
||||
| Custom metric checks | :heavy_check_mark: | :heavy_check_mark: | :heavy_check_mark: | :heavy_check_mark: |
|
||||
| Feature | App Mesh | Istio | Linkerd | SMI | Kubernetes CNI |
|
||||
| ------------------------------------------ | ------------------ | ------------------ | ------------------ | ----------------- | ----------------- |
|
||||
| Canary deployments (weighted traffic) | :heavy_check_mark: | :heavy_check_mark: | :heavy_check_mark: | :heavy_check_mark: | :heavy_minus_sign: |
|
||||
| A/B testing (headers and cookies routing) | :heavy_check_mark: | :heavy_check_mark: | :heavy_minus_sign: | :heavy_minus_sign: | :heavy_minus_sign: |
|
||||
| Blue/Green deployments (traffic switch) | :heavy_check_mark: | :heavy_check_mark: | :heavy_check_mark: | :heavy_check_mark: | :heavy_check_mark: |
|
||||
| Blue/Green deployments (traffic mirroring) | :heavy_minus_sign: | :heavy_check_mark: | :heavy_minus_sign: | :heavy_minus_sign: | :heavy_minus_sign: |
|
||||
| Webhooks (acceptance/load testing) | :heavy_check_mark: | :heavy_check_mark: | :heavy_check_mark: | :heavy_check_mark: | :heavy_check_mark: |
|
||||
| Manual gating (approve/pause/resume) | :heavy_check_mark: | :heavy_check_mark: | :heavy_check_mark: | :heavy_check_mark: | :heavy_check_mark: |
|
||||
| Request success rate check (L7 metric) | :heavy_check_mark: | :heavy_check_mark: | :heavy_check_mark: | :heavy_minus_sign: | :heavy_minus_sign: |
|
||||
| Request duration check (L7 metric) | :heavy_check_mark: | :heavy_check_mark: | :heavy_check_mark: | :heavy_minus_sign: | :heavy_minus_sign: |
|
||||
| Custom metric checks | :heavy_check_mark: | :heavy_check_mark: | :heavy_check_mark: | :heavy_check_mark: | :heavy_check_mark: |
|
||||
|
||||
For SMI compatible service mesh solutions like Open Service Mesh, Consul Connect or Nginx Service Mesh,
|
||||
[Prometheus MetricTemplates](https://docs.flagger.app/usage/metrics#prometheus) can be used to implement
|
||||
the request success rate and request duration checks.
|
||||
|
||||
**Ingress**
|
||||
|
||||
| Feature | Contour | Gloo | NGINX | Skipper | Traefik |
|
||||
| ------------------------------------------ | ------------------ | ------------------ | ------------------ | ------------------ | ------------------ |
|
||||
| Canary deployments (weighted traffic) | :heavy_check_mark: | :heavy_check_mark: | :heavy_check_mark: | :heavy_check_mark: | :heavy_check_mark: |
|
||||
| A/B testing (headers and cookies routing) | :heavy_check_mark: | :heavy_minus_sign: | :heavy_check_mark: | :heavy_minus_sign: | :heavy_minus_sign: |
|
||||
| A/B testing (headers and cookies routing) | :heavy_check_mark: | :heavy_check_mark: | :heavy_check_mark: | :heavy_minus_sign: | :heavy_minus_sign: |
|
||||
| Blue/Green deployments (traffic switch) | :heavy_check_mark: | :heavy_check_mark: | :heavy_check_mark: | :heavy_check_mark: | :heavy_check_mark: |
|
||||
| Webhooks (acceptance/load testing) | :heavy_check_mark: | :heavy_check_mark: | :heavy_check_mark: | :heavy_check_mark: | :heavy_check_mark: |
|
||||
| Manual gating (approve/pause/resume) | :heavy_check_mark: | :heavy_check_mark: | :heavy_check_mark: | :heavy_check_mark: | :heavy_check_mark: |
|
||||
@@ -212,18 +213,16 @@ For more details on how the canary analysis and promotion works please [read the
|
||||
|
||||
### Roadmap
|
||||
|
||||
#### [GitOps Toolkit](https://github.com/fluxcd/toolkit) compatibility
|
||||
#### [GitOps Toolkit](https://github.com/fluxcd/flux2) compatibility
|
||||
|
||||
* Migrate Flagger to Kubernetes controller-runtime and [kubebuilder](https://github.com/kubernetes-sigs/kubebuilder)
|
||||
* Make the Canary status compatible with [kstatus](https://github.com/kubernetes-sigs/cli-utils)
|
||||
* Make Flagger emit Kubernetes events compatible with Flux v2 notification API
|
||||
* Migrate CI to GitHub Actions and publish AMD64, ARM64 and ARMv7 container images
|
||||
* Integrate Flagger into Flux v2 as the progressive delivery component
|
||||
|
||||
#### Integrations
|
||||
|
||||
* Add support for Kubernetes [Ingress v2](https://github.com/kubernetes-sigs/service-apis)
|
||||
* Add support for SMI compatible service mesh solutions like Open Service Mesh and Consul Connect
|
||||
* Add support for ingress controllers like HAProxy and ALB
|
||||
* Add support for metrics providers like InfluxDB, Stackdriver, SignalFX
|
||||
|
||||
@@ -245,10 +244,10 @@ When submitting bug reports please include as much details as possible:
|
||||
If you have any questions about Flagger and progressive delivery:
|
||||
|
||||
* Read the Flagger [docs](https://docs.flagger.app).
|
||||
* Invite yourself to the [Weave community slack](https://slack.weave.works/)
|
||||
and join the [#flagger](https://weave-community.slack.com/messages/flagger/) channel.
|
||||
* Join the [Weave User Group](https://www.meetup.com/pro/Weave/) and get invited to online talks,
|
||||
hands-on training and meetups in your area.
|
||||
* File an [issue](https://github.com/weaveworks/flagger/issues/new).
|
||||
* Invite yourself to the [CNCF community slack](https://slack.cncf.io/)
|
||||
and join the [#flagger](https://cloud-native.slack.com/messages/flagger/) channel.
|
||||
* Check out the [Flux talks section](https://fluxcd.io/community/#talks) and to see a list of online talks,
|
||||
hands-on training and meetups.
|
||||
* File an [issue](https://github.com/fluxcd/flagger/issues/new).
|
||||
|
||||
Your feedback is always welcome!
|
||||
|
||||
@@ -153,8 +153,19 @@ rules:
|
||||
resources:
|
||||
- upstreams
|
||||
- upstreams/finalizers
|
||||
- upstreamgroups
|
||||
- upstreamgroups/finalizers
|
||||
verbs:
|
||||
- get
|
||||
- list
|
||||
- watch
|
||||
- create
|
||||
- update
|
||||
- patch
|
||||
- delete
|
||||
- apiGroups:
|
||||
- gateway.solo.io
|
||||
resources:
|
||||
- routetables
|
||||
- routetables/finalizers
|
||||
verbs:
|
||||
- get
|
||||
- list
|
||||
|
||||
@@ -22,7 +22,7 @@ spec:
|
||||
serviceAccountName: flagger
|
||||
containers:
|
||||
- name: flagger
|
||||
image: weaveworks/flagger:1.4.2
|
||||
image: ghcr.io/fluxcd/flagger:1.9.0
|
||||
imagePullPolicy: IfNotPresent
|
||||
ports:
|
||||
- name: http
|
||||
|
||||
@@ -1,14 +1,14 @@
|
||||
apiVersion: v1
|
||||
name: flagger
|
||||
version: 1.4.2
|
||||
appVersion: 1.4.2
|
||||
kubeVersion: ">=1.11.0-0"
|
||||
version: 1.9.0
|
||||
appVersion: 1.9.0
|
||||
kubeVersion: ">=1.16.0-0"
|
||||
engine: gotpl
|
||||
description: Flagger is a progressive delivery operator for Kubernetes
|
||||
home: https://flagger.app
|
||||
icon: https://raw.githubusercontent.com/weaveworks/flagger/master/docs/logo/weaveworks.png
|
||||
icon: https://raw.githubusercontent.com/fluxcd/flagger/main/docs/logo/flagger-icon.png
|
||||
sources:
|
||||
- https://github.com/weaveworks/flagger
|
||||
- https://github.com/fluxcd/flagger
|
||||
maintainers:
|
||||
- name: stefanprodan
|
||||
url: https://github.com/stefanprodan
|
||||
@@ -21,5 +21,6 @@ keywords:
|
||||
- gloo
|
||||
- contour
|
||||
- nginx
|
||||
- traefik
|
||||
- gitops
|
||||
- canary
|
||||
|
||||
@@ -186,7 +186,7 @@
|
||||
same "printed page" as the copyright notice for easier
|
||||
identification within third-party archives.
|
||||
|
||||
Copyright 2018 Weaveworks. All rights reserved.
|
||||
Copyright [yyyy] [name of copyright owner]
|
||||
|
||||
Licensed under the Apache License, Version 2.0 (the "License");
|
||||
you may not use this file except in compliance with the License.
|
||||
|
||||
@@ -1,18 +1,22 @@
|
||||
# Flagger
|
||||
|
||||
[Flagger](https://github.com/weaveworks/flagger) is an operator that automates the release process of applications on Kubernetes.
|
||||
[Flagger](https://github.com/fluxcd/flagger) is an operator that automates the release process of applications on Kubernetes.
|
||||
|
||||
Flagger can run automated application analysis, testing, promotion and rollback for the following deployment strategies:
|
||||
* Canary Release (progressive traffic shifting)
|
||||
* A/B Testing (HTTP headers and cookies traffic routing)
|
||||
* Blue/Green (traffic switching and mirroring)
|
||||
|
||||
Flagger works with service mesh solutions (Istio, Linkerd, AWS App Mesh) and with Kubernetes ingress controllers (NGINX, Skipper, Gloo, Contour, Traefik).
|
||||
Flagger works with service mesh solutions (Istio, Linkerd, AWS App Mesh) and with Kubernetes ingress controllers
|
||||
(NGINX, Skipper, Gloo, Contour, Traefik).
|
||||
Flagger can be configured to send alerts to various chat platforms such as Slack, Microsoft Teams, Discord and Rocket.
|
||||
|
||||
Flagger is a [Cloud Native Computing Foundation](https://cncf.io/) project
|
||||
and part of [Flux](https://fluxcd.io) family of GitOps tools.
|
||||
|
||||
## Prerequisites
|
||||
|
||||
* Kubernetes >= 1.14
|
||||
* Kubernetes >= 1.16
|
||||
|
||||
## Installing the Chart
|
||||
|
||||
@@ -25,7 +29,7 @@ $ helm repo add flagger https://flagger.app
|
||||
Install Flagger's custom resource definitions:
|
||||
|
||||
```console
|
||||
$ kubectl apply -f https://raw.githubusercontent.com/weaveworks/flagger/master/artifacts/flagger/crd.yaml
|
||||
$ kubectl apply -f https://raw.githubusercontent.com/fluxcd/flagger/main/artifacts/flagger/crd.yaml
|
||||
```
|
||||
|
||||
To install Flagger for **Istio**:
|
||||
@@ -37,13 +41,13 @@ $ helm upgrade -i flagger flagger/flagger \
|
||||
--set metricsServer=http://prometheus:9090
|
||||
```
|
||||
|
||||
To install Flagger for **Linkerd**:
|
||||
To install Flagger for **Linkerd** (requires Linkerd Viz extension):
|
||||
|
||||
```console
|
||||
$ helm upgrade -i flagger flagger/flagger \
|
||||
--namespace=linkerd \
|
||||
--set meshProvider=linkerd \
|
||||
--set metricsServer=http://linkerd-prometheus:9090
|
||||
--set metricsServer=http://prometheus.linkerd-viz:9090
|
||||
```
|
||||
|
||||
To install Flagger for **AWS App Mesh**:
|
||||
@@ -64,7 +68,7 @@ $ helm upgrade -i flagger flagger/flagger \
|
||||
--set prometheus.install=true
|
||||
```
|
||||
|
||||
To install Flagger and Prometheus for **Gloo** (requires Gloo discovery enabled):
|
||||
To install Flagger and Prometheus for **Gloo** (no longer requires Gloo discovery):
|
||||
|
||||
```console
|
||||
$ helm upgrade -i flagger flagger/flagger \
|
||||
@@ -87,7 +91,7 @@ To install Flagger and Prometheus for **Traefik**:
|
||||
|
||||
```console
|
||||
$ helm upgrade -i flagger flagger/flagger \
|
||||
--namespace traefik \
|
||||
--namespace=traefik \
|
||||
--set prometheus.install=true \
|
||||
--set meshProvider=traefik
|
||||
```
|
||||
@@ -110,7 +114,7 @@ The following tables lists the configurable parameters of the Flagger chart and
|
||||
|
||||
Parameter | Description | Default
|
||||
--- | --- | ---
|
||||
`image.repository` | Image repository | `weaveworks/flagger`
|
||||
`image.repository` | Image repository | `ghcr.io/fluxcd/flagger`
|
||||
`image.tag` | Image tag | `<VERSION>`
|
||||
`image.pullPolicy` | Image pull policy | `IfNotPresent`
|
||||
`logLevel` | Log level | `info`
|
||||
@@ -121,12 +125,14 @@ Parameter | Description | Default
|
||||
`configTracking.enabled` | If `true`, flagger will track changes in Secrets and ConfigMaps referenced in the target deployment | `true`
|
||||
`eventWebhook` | If set, Flagger will publish events to the given webhook | None
|
||||
`slack.url` | Slack incoming webhook | None
|
||||
`slack.proxyUrl` | Slack proxy url | None
|
||||
`slack.channel` | Slack channel | None
|
||||
`slack.user` | Slack username | `flagger`
|
||||
`msteams.url` | Microsoft Teams incoming webhook | None
|
||||
`msteams.proxyUrl` | Microsoft Teams proxy url | None
|
||||
`podMonitor.enabled` | If `true`, create a PodMonitor for [monitoring the metrics](https://docs.flagger.app/usage/monitoring#metrics) | `false`
|
||||
`podMonitor.namespace` | Namespace where the PodMonitor is created | the same namespace
|
||||
`podMonitor.interval` | Interval at which metrics should be scraped | `15s`
|
||||
`podMonitor.namespace` | Namespace where the PodMonitor is created | the same namespace
|
||||
`podMonitor.interval` | Interval at which metrics should be scraped | `15s`
|
||||
`podMonitor.podMonitor` | Additional labels to add to the PodMonitor | `{}`
|
||||
`leaderElection.enabled` | If `true`, Flagger will run in HA mode | `false`
|
||||
`leaderElection.replicaCount` | Number of replicas | `1`
|
||||
@@ -151,6 +157,8 @@ Parameter | Description | Default
|
||||
`ingressAnnotationsPrefix` | Annotations prefix for NGINX ingresses | None
|
||||
`ingressClass` | Ingress class used for annotating HTTPProxy objects, e.g. `contour` | None
|
||||
`podPriorityClassName` | PriorityClass name for pod priority configuration | ""
|
||||
`podDisruptionBudget.enabled` | A PodDisruptionBudget will be created if `true` | `false`
|
||||
`podDisruptionBudget.minAvailable` | The minimal number of available replicas that will be set in the PodDisruptionBudget | `1`
|
||||
|
||||
Specify each parameter using the `--set key=value[,key=value]` argument to `helm upgrade`. For example,
|
||||
|
||||
@@ -170,5 +178,3 @@ $ helm upgrade -i flagger flagger/flagger \
|
||||
```
|
||||
|
||||
> **Tip**: You can use the default [values.yaml](values.yaml)
|
||||
|
||||
|
||||
|
||||
@@ -90,6 +90,9 @@ spec:
|
||||
{{- if .Values.slack.url }}
|
||||
- -slack-url={{ .Values.slack.url }}
|
||||
{{- end }}
|
||||
{{- if .Values.slack.proxyUrl }}
|
||||
- -slack-proxy-url={{ .Values.slack.proxyUrl }}
|
||||
{{- end }}
|
||||
{{- if .Values.slack.user }}
|
||||
- -slack-user={{ .Values.slack.user }}
|
||||
{{- end }}
|
||||
@@ -99,6 +102,9 @@ spec:
|
||||
{{- if .Values.msteams.url }}
|
||||
- -msteams-url={{ .Values.msteams.url }}
|
||||
{{- end }}
|
||||
{{- if .Values.msteams.proxyUrl }}
|
||||
- -msteams-proxy-url={{ .Values.msteams.proxyUrl }}
|
||||
{{- end }}
|
||||
{{- if .Values.leaderElection.enabled }}
|
||||
- -enable-leader-election=true
|
||||
- -leader-election-namespace={{ .Release.Namespace }}
|
||||
|
||||
11
charts/flagger/templates/pdb.yaml
Normal file
@@ -0,0 +1,11 @@
|
||||
{{- if .Values.podDisruptionBudget.enabled }}
|
||||
apiVersion: policy/v1beta1
|
||||
kind: PodDisruptionBudget
|
||||
metadata:
|
||||
name: {{ template "flagger.name" . }}
|
||||
spec:
|
||||
minAvailable: {{ .Values.podDisruptionBudget.minAvailable }}
|
||||
selector:
|
||||
matchLabels:
|
||||
app.kubernetes.io/name: {{ template "flagger.name" . }}
|
||||
{{- end }}
|
||||
@@ -255,7 +255,14 @@ spec:
|
||||
mountPath: /etc/prometheus
|
||||
- name: data-volume
|
||||
mountPath: /prometheus/data
|
||||
|
||||
{{- if .Values.prometheus.securityContext.enabled }}
|
||||
securityContext:
|
||||
{{ toYaml .Values.prometheus.securityContext.context | indent 12 }}
|
||||
{{- end }}
|
||||
{{- if .Values.prometheus.pullSecret }}
|
||||
imagePullSecrets:
|
||||
- name: {{ .Values.prometheus.pullSecret }}
|
||||
{{- end }}
|
||||
volumes:
|
||||
- name: config-volume
|
||||
configMap:
|
||||
|
||||
@@ -149,8 +149,19 @@ rules:
|
||||
resources:
|
||||
- upstreams
|
||||
- upstreams/finalizers
|
||||
- upstreamgroups
|
||||
- upstreamgroups/finalizers
|
||||
verbs:
|
||||
- get
|
||||
- list
|
||||
- watch
|
||||
- create
|
||||
- update
|
||||
- patch
|
||||
- delete
|
||||
- apiGroups:
|
||||
- gateway.solo.io
|
||||
resources:
|
||||
- routetables
|
||||
- routetables/finalizers
|
||||
verbs:
|
||||
- get
|
||||
- list
|
||||
|
||||
@@ -1,8 +1,8 @@
|
||||
# Default values for flagger.
|
||||
|
||||
image:
|
||||
repository: weaveworks/flagger
|
||||
tag: 1.4.2
|
||||
repository: ghcr.io/fluxcd/flagger
|
||||
tag: 1.9.0
|
||||
pullPolicy: IfNotPresent
|
||||
pullSecret:
|
||||
|
||||
@@ -55,6 +55,7 @@ slack:
|
||||
channel:
|
||||
# incoming webhook https://api.slack.com/incoming-webhooks
|
||||
url:
|
||||
proxy:
|
||||
|
||||
msteams:
|
||||
# MS Teams incoming webhook URL
|
||||
@@ -72,11 +73,21 @@ podMonitor:
|
||||
# secretKeyRef:
|
||||
# name: slack
|
||||
# key: url
|
||||
#- name: SLACK_PROXY_URL
|
||||
# valueFrom:
|
||||
# secretKeyRef:
|
||||
# name: slack
|
||||
# key: proxy-url
|
||||
#- name: MSTEAMS_URL
|
||||
# valueFrom:
|
||||
# secretKeyRef:
|
||||
# name: msteams
|
||||
# key: url
|
||||
#- name: MSTEAMS_PROXY_URL
|
||||
# valueFrom:
|
||||
# secretKeyRef:
|
||||
# name: msteams
|
||||
# key: proxy-url
|
||||
#- name: EVENT_WEBHOOK_URL
|
||||
# valueFrom:
|
||||
# secretKeyRef:
|
||||
@@ -125,7 +136,14 @@ prometheus:
|
||||
# to be used with ingress controllers
|
||||
install: false
|
||||
image: docker.io/prom/prometheus:v2.23.0
|
||||
pullSecret:
|
||||
retention: 2h
|
||||
# when enabled, it will add a security context for the prometheus pod
|
||||
securityContext:
|
||||
enabled: false
|
||||
context:
|
||||
readOnlyRootFilesystem: true
|
||||
runAsUser: 10001
|
||||
|
||||
kubeconfigQPS: ""
|
||||
kubeconfigBurst: ""
|
||||
@@ -138,3 +156,7 @@ istio:
|
||||
secretName: ""
|
||||
# istio.kubeconfig.key: The name of secret data key that contains the Istio control plane kubeconfig
|
||||
key: "kubeconfig"
|
||||
|
||||
podDisruptionBudget:
|
||||
enabled: false
|
||||
minAvailable: 1
|
||||
|
||||
@@ -3,10 +3,10 @@ name: grafana
|
||||
version: 1.5.0
|
||||
appVersion: 7.2.0
|
||||
description: Grafana dashboards for monitoring Flagger canary deployments
|
||||
icon: https://raw.githubusercontent.com/weaveworks/flagger/master/docs/logo/weaveworks.png
|
||||
icon: https://raw.githubusercontent.com/fluxcd/flagger/main/docs/logo/flagger-icon.png
|
||||
home: https://flagger.app
|
||||
sources:
|
||||
- https://github.com/weaveworks/flagger
|
||||
- https://github.com/fluxcd/flagger
|
||||
maintainers:
|
||||
- name: stefanprodan
|
||||
url: https://github.com/stefanprodan
|
||||
|
||||
@@ -2,7 +2,7 @@
|
||||
|
||||
Grafana dashboards for monitoring progressive deployments powered by Flagger and Prometheus.
|
||||
|
||||

|
||||
|
||||
|
||||
## Prerequisites
|
||||
|
||||
|
||||
@@ -1,14 +1,14 @@
|
||||
apiVersion: v1
|
||||
name: loadtester
|
||||
version: 0.18.0
|
||||
version: 0.19.0
|
||||
appVersion: 0.18.0
|
||||
kubeVersion: ">=1.11.0-0"
|
||||
engine: gotpl
|
||||
description: Flagger's load testing services based on rakyll/hey and bojand/ghz that generates traffic during canary analysis when configured as a webhook.
|
||||
home: https://docs.flagger.app
|
||||
icon: https://raw.githubusercontent.com/weaveworks/flagger/master/docs/logo/weaveworks.png
|
||||
icon: https://raw.githubusercontent.com/fluxcd/flagger/main/docs/logo/flagger-icon.png
|
||||
sources:
|
||||
- https://github.com/weaveworks/flagger
|
||||
- https://github.com/fluxcd/flagger
|
||||
maintainers:
|
||||
- name: stefanprodan
|
||||
url: https://github.com/stefanprodan
|
||||
|
||||
@@ -1,7 +1,7 @@
|
||||
# Flagger load testing service
|
||||
|
||||
[Flagger's](https://github.com/weaveworks/flagger) load testing service is based on
|
||||
[rakyll/hey](https://github.com/rakyll/hey) and
|
||||
[Flagger's](https://github.com/fluxcd/flagger) load testing service is based on
|
||||
[rakyll/hey](https://github.com/rakyll/hey) and
|
||||
[bojand/ghz](https://github.com/bojand/ghz).
|
||||
It can be used to generate HTTP and gRPC traffic during canary analysis when configured as a webhook.
|
||||
|
||||
@@ -50,7 +50,7 @@ Parameter | Description | Default
|
||||
`image.pullPolicy` | Image pull policy | `IfNotPresent`
|
||||
`image.tag` | Image tag | `<VERSION>`
|
||||
`replicaCount` | Desired number of pods | `1`
|
||||
`serviceAccountName` | Kubernetes service account name | `none`
|
||||
`serviceAccountName` | Kubernetes service account name | `none`
|
||||
`resources.requests.cpu` | CPU requests | `10m`
|
||||
`resources.requests.memory` | Memory requests | `64Mi`
|
||||
`tolerations` | List of node taints to tolerate | `[]`
|
||||
@@ -70,6 +70,8 @@ Parameter | Description | Default
|
||||
`podPriorityClassName` | PriorityClass name for pod priority configuration | ""
|
||||
`securityContext.enabled` | Add securityContext to container | ""
|
||||
`securityContext.context` | securityContext to add | ""
|
||||
`podDisruptionBudget.enabled` | A PodDisruptionBudget will be created if `true` | `false`
|
||||
`podDisruptionBudget.minAvailable` | The minimal number of available replicas that will be set in the PodDisruptionBudget | `1`
|
||||
|
||||
Specify each parameter using the `--set key=value[,key=value]` argument to `helm upgrade`. For example,
|
||||
|
||||
@@ -87,5 +89,3 @@ helm install flagger/loadtester --name flagger-loadtester -f values.yaml
|
||||
```
|
||||
|
||||
> **Tip**: You can use the default [values.yaml](values.yaml)
|
||||
|
||||
|
||||
|
||||
@@ -16,6 +16,7 @@ spec:
|
||||
metadata:
|
||||
labels:
|
||||
app: {{ include "loadtester.name" . }}
|
||||
app.kubernetes.io/name: {{ include "loadtester.name" . }}
|
||||
annotations:
|
||||
appmesh.k8s.aws/ports: "444"
|
||||
{{- if .Values.podAnnotations }}
|
||||
@@ -29,7 +30,7 @@ spec:
|
||||
{{- end }}
|
||||
{{- if .Values.podPriorityClassName }}
|
||||
priorityClassName: {{ .Values.podPriorityClassName }}
|
||||
{{- end }}
|
||||
{{- end }}
|
||||
containers:
|
||||
- name: {{ .Chart.Name }}
|
||||
{{- if .Values.securityContext.enabled }}
|
||||
@@ -66,6 +67,10 @@ spec:
|
||||
- --spider
|
||||
- http://localhost:8080/healthz
|
||||
timeoutSeconds: 5
|
||||
{{- if .Values.env }}
|
||||
env:
|
||||
{{- toYaml .Values.env | nindent 12 }}
|
||||
{{- end }}
|
||||
resources:
|
||||
{{- toYaml .Values.resources | nindent 12 }}
|
||||
{{- with .Values.nodeSelector }}
|
||||
|
||||
11
charts/loadtester/templates/pdb.yaml
Normal file
@@ -0,0 +1,11 @@
|
||||
{{- if .Values.podDisruptionBudget.enabled }}
|
||||
apiVersion: policy/v1beta1
|
||||
kind: PodDisruptionBudget
|
||||
metadata:
|
||||
name: {{ include "loadtester.fullname" . }}
|
||||
spec:
|
||||
minAvailable: {{ .Values.podDisruptionBudget.minAvailable }}
|
||||
selector:
|
||||
matchLabels:
|
||||
app.kubernetes.io/name: {{ include "loadtester.name" . }}
|
||||
{{- end }}
|
||||
@@ -1,7 +1,7 @@
|
||||
replicaCount: 1
|
||||
|
||||
image:
|
||||
repository: weaveworks/flagger-loadtester
|
||||
repository: ghcr.io/fluxcd/flagger-loadtester
|
||||
tag: 0.18.0
|
||||
pullPolicy: IfNotPresent
|
||||
|
||||
@@ -9,7 +9,7 @@ podAnnotations:
|
||||
prometheus.io/scrape: "true"
|
||||
prometheus.io/port: "8080"
|
||||
|
||||
podPriorityClassName: ""
|
||||
podPriorityClassName: ""
|
||||
|
||||
logLevel: info
|
||||
cmd:
|
||||
@@ -18,6 +18,8 @@ cmd:
|
||||
nameOverride: ""
|
||||
fullnameOverride: ""
|
||||
|
||||
env: []
|
||||
|
||||
service:
|
||||
type: ClusterIP
|
||||
port: 80
|
||||
@@ -62,15 +64,15 @@ appmesh:
|
||||
- podinfo
|
||||
- podinfo-canary
|
||||
|
||||
#Istio virtual service and gatway settings. TLS secrets should be in namespace before enbaled it. ( secret format loadtester.fullname )
|
||||
#Istio virtual service and gatway settings. TLS secrets should be in namespace before enbaled it. ( secret format loadtester.fullname )
|
||||
istio:
|
||||
enabled: false
|
||||
host: flagger-loadtester.flagger
|
||||
gateway:
|
||||
enabled: false
|
||||
enabled: false
|
||||
tls:
|
||||
enabled: false
|
||||
httpsRedirect: false
|
||||
httpsRedirect: false
|
||||
|
||||
# when enabled, it will add a security context for the loadtester pod
|
||||
securityContext:
|
||||
@@ -79,3 +81,7 @@ securityContext:
|
||||
readOnlyRootFilesystem: true
|
||||
runAsUser: 100
|
||||
runAsGroup: 101
|
||||
|
||||
podDisruptionBudget:
|
||||
enabled: false
|
||||
minAvailable: 1
|
||||
|
||||
@@ -5,7 +5,7 @@ name: podinfo
|
||||
engine: gotpl
|
||||
description: Flagger canary deployment demo application
|
||||
home: https://docs.flagger.app
|
||||
icon: https://raw.githubusercontent.com/weaveworks/flagger/master/docs/logo/weaveworks.png
|
||||
icon: https://raw.githubusercontent.com/fluxcd/flagger/main/docs/logo/flagger-icon.png
|
||||
sources:
|
||||
- https://github.com/stefanprodan/podinfo
|
||||
maintainers:
|
||||
|
||||
@@ -1,3 +1,19 @@
|
||||
/*
|
||||
Copyright 2020 The Flux authors
|
||||
|
||||
Licensed under the Apache License, Version 2.0 (the "License");
|
||||
you may not use this file except in compliance with the License.
|
||||
You may obtain a copy of the License at
|
||||
|
||||
http://www.apache.org/licenses/LICENSE-2.0
|
||||
|
||||
Unless required by applicable law or agreed to in writing, software
|
||||
distributed under the License is distributed on an "AS IS" BASIS,
|
||||
WITHOUT WARRANTIES OR CONDITIONS OF ANY KIND, either express or implied.
|
||||
See the License for the specific language governing permissions and
|
||||
limitations under the License.
|
||||
*/
|
||||
|
||||
package main
|
||||
|
||||
import (
|
||||
@@ -9,7 +25,8 @@ import (
|
||||
"strings"
|
||||
"time"
|
||||
|
||||
semver "github.com/Masterminds/semver/v3"
|
||||
"github.com/Masterminds/semver/v3"
|
||||
"github.com/go-logr/zapr"
|
||||
"go.uber.org/zap"
|
||||
metav1 "k8s.io/apimachinery/pkg/apis/meta/v1"
|
||||
"k8s.io/apimachinery/pkg/util/uuid"
|
||||
@@ -21,18 +38,19 @@ import (
|
||||
"k8s.io/client-go/tools/leaderelection/resourcelock"
|
||||
"k8s.io/client-go/transport"
|
||||
_ "k8s.io/code-generator/cmd/client-gen/generators"
|
||||
"k8s.io/klog/v2"
|
||||
|
||||
"github.com/weaveworks/flagger/pkg/canary"
|
||||
clientset "github.com/weaveworks/flagger/pkg/client/clientset/versioned"
|
||||
informers "github.com/weaveworks/flagger/pkg/client/informers/externalversions"
|
||||
"github.com/weaveworks/flagger/pkg/controller"
|
||||
"github.com/weaveworks/flagger/pkg/logger"
|
||||
"github.com/weaveworks/flagger/pkg/metrics/observers"
|
||||
"github.com/weaveworks/flagger/pkg/notifier"
|
||||
"github.com/weaveworks/flagger/pkg/router"
|
||||
"github.com/weaveworks/flagger/pkg/server"
|
||||
"github.com/weaveworks/flagger/pkg/signals"
|
||||
"github.com/weaveworks/flagger/pkg/version"
|
||||
"github.com/fluxcd/flagger/pkg/canary"
|
||||
clientset "github.com/fluxcd/flagger/pkg/client/clientset/versioned"
|
||||
informers "github.com/fluxcd/flagger/pkg/client/informers/externalversions"
|
||||
"github.com/fluxcd/flagger/pkg/controller"
|
||||
"github.com/fluxcd/flagger/pkg/logger"
|
||||
"github.com/fluxcd/flagger/pkg/metrics/observers"
|
||||
"github.com/fluxcd/flagger/pkg/notifier"
|
||||
"github.com/fluxcd/flagger/pkg/router"
|
||||
"github.com/fluxcd/flagger/pkg/server"
|
||||
"github.com/fluxcd/flagger/pkg/signals"
|
||||
"github.com/fluxcd/flagger/pkg/version"
|
||||
)
|
||||
|
||||
var (
|
||||
@@ -45,8 +63,10 @@ var (
|
||||
logLevel string
|
||||
port string
|
||||
msteamsURL string
|
||||
msteamsProxyURL string
|
||||
includeLabelPrefix string
|
||||
slackURL string
|
||||
slackProxyURL string
|
||||
slackUser string
|
||||
slackChannel string
|
||||
eventWebhook string
|
||||
@@ -75,10 +95,12 @@ func init() {
|
||||
flag.StringVar(&logLevel, "log-level", "debug", "Log level can be: debug, info, warning, error.")
|
||||
flag.StringVar(&port, "port", "8080", "Port to listen on.")
|
||||
flag.StringVar(&slackURL, "slack-url", "", "Slack hook URL.")
|
||||
flag.StringVar(&slackProxyURL, "slack-proxy-url", "", "Slack proxy URL.")
|
||||
flag.StringVar(&slackUser, "slack-user", "flagger", "Slack user name.")
|
||||
flag.StringVar(&slackChannel, "slack-channel", "", "Slack channel.")
|
||||
flag.StringVar(&eventWebhook, "event-webhook", "", "Webhook for publishing flagger events")
|
||||
flag.StringVar(&msteamsURL, "msteams-url", "", "MS Teams incoming webhook URL.")
|
||||
flag.StringVar(&msteamsProxyURL, "msteams-proxy-url", "", "MS Teams proxy URL.")
|
||||
flag.StringVar(&includeLabelPrefix, "include-label-prefix", "", "List of prefixes of labels that are copied when creating primary deployments or daemonsets. Use * to include all.")
|
||||
flag.IntVar(&threadiness, "threadiness", 2, "Worker concurrency.")
|
||||
flag.BoolVar(&zapReplaceGlobals, "zap-replace-globals", false, "Whether to change the logging level of the global zap logger.")
|
||||
@@ -96,6 +118,7 @@ func init() {
|
||||
}
|
||||
|
||||
func main() {
|
||||
klog.InitFlags(nil)
|
||||
flag.Parse()
|
||||
|
||||
if ver {
|
||||
@@ -111,6 +134,8 @@ func main() {
|
||||
zap.ReplaceGlobals(logger.Desugar())
|
||||
}
|
||||
|
||||
klog.SetLogger(zapr.NewLogger(logger.Desugar()))
|
||||
|
||||
defer logger.Sync()
|
||||
|
||||
stopCh := signals.SetupSignalHandler()
|
||||
@@ -328,11 +353,13 @@ func startLeaderElection(ctx context.Context, run func(), ns string, kubeClient
|
||||
func initNotifier(logger *zap.SugaredLogger) (client notifier.Interface) {
|
||||
provider := "slack"
|
||||
notifierURL := fromEnv("SLACK_URL", slackURL)
|
||||
notifierProxyURL := fromEnv("SLACK_PROXY_URL", slackProxyURL)
|
||||
if msteamsURL != "" || os.Getenv("MSTEAMS_URL") != "" {
|
||||
provider = "msteams"
|
||||
notifierURL = fromEnv("MSTEAMS_URL", msteamsURL)
|
||||
notifierProxyURL = fromEnv("MSTEAMS_PROXY_URL", msteamsProxyURL)
|
||||
}
|
||||
notifierFactory := notifier.NewFactory(notifierURL, slackUser, slackChannel)
|
||||
notifierFactory := notifier.NewFactory(notifierURL, notifierProxyURL, slackUser, slackChannel)
|
||||
|
||||
var err error
|
||||
client, err = notifierFactory.Notifier(provider)
|
||||
|
||||
@@ -1,3 +1,19 @@
|
||||
/*
|
||||
Copyright 2020 The Flux authors
|
||||
|
||||
Licensed under the Apache License, Version 2.0 (the "License");
|
||||
you may not use this file except in compliance with the License.
|
||||
You may obtain a copy of the License at
|
||||
|
||||
http://www.apache.org/licenses/LICENSE-2.0
|
||||
|
||||
Unless required by applicable law or agreed to in writing, software
|
||||
distributed under the License is distributed on an "AS IS" BASIS,
|
||||
WITHOUT WARRANTIES OR CONDITIONS OF ANY KIND, either express or implied.
|
||||
See the License for the specific language governing permissions and
|
||||
limitations under the License.
|
||||
*/
|
||||
|
||||
package main
|
||||
|
||||
import (
|
||||
@@ -5,9 +21,9 @@ import (
|
||||
"log"
|
||||
"time"
|
||||
|
||||
"github.com/weaveworks/flagger/pkg/loadtester"
|
||||
"github.com/weaveworks/flagger/pkg/logger"
|
||||
"github.com/weaveworks/flagger/pkg/signals"
|
||||
"github.com/fluxcd/flagger/pkg/loadtester"
|
||||
"github.com/fluxcd/flagger/pkg/logger"
|
||||
"github.com/fluxcd/flagger/pkg/signals"
|
||||
"go.uber.org/zap"
|
||||
)
|
||||
|
||||
|
||||
@@ -1,73 +0,0 @@
|
||||
# Contributor Covenant Code of Conduct
|
||||
|
||||
## Our Pledge
|
||||
|
||||
In the interest of fostering an open and welcoming environment, we as
|
||||
contributors and maintainers pledge to making participation in our project and
|
||||
our community a harassment-free experience for everyone, regardless of age, body
|
||||
size, disability, ethnicity, gender identity and expression, level of experience,
|
||||
education, socio-economic status, nationality, personal appearance, race,
|
||||
religion, or sexual identity and orientation.
|
||||
|
||||
## Our Standards
|
||||
|
||||
Examples of behavior that contributes to creating a positive environment
|
||||
include:
|
||||
|
||||
* Using welcoming and inclusive language
|
||||
* Being respectful of differing viewpoints and experiences
|
||||
* Gracefully accepting constructive criticism
|
||||
* Focusing on what is best for the community
|
||||
* Showing empathy towards other community members
|
||||
|
||||
Examples of unacceptable behavior by participants include:
|
||||
|
||||
* The use of sexualized language or imagery and unwelcome sexual attention or
|
||||
advances
|
||||
* Trolling, insulting/derogatory comments, and personal or political attacks
|
||||
* Public or private harassment
|
||||
* Publishing others' private information, such as a physical or electronic
|
||||
address, without explicit permission
|
||||
* Other conduct which could reasonably be considered inappropriate in a
|
||||
professional setting
|
||||
|
||||
## Our Responsibilities
|
||||
|
||||
Project maintainers are responsible for clarifying the standards of acceptable
|
||||
behavior and are expected to take appropriate and fair corrective action in
|
||||
response to any instances of unacceptable behavior.
|
||||
|
||||
Project maintainers have the right and responsibility to remove, edit, or
|
||||
reject comments, commits, code, wiki edits, issues, and other contributions
|
||||
that are not aligned to this Code of Conduct, or to ban temporarily or
|
||||
permanently any contributor for other behaviors that they deem inappropriate,
|
||||
threatening, offensive, or harmful.
|
||||
|
||||
## Scope
|
||||
|
||||
This Code of Conduct applies both within project spaces and in public spaces
|
||||
when an individual is representing the project or its community. Examples of
|
||||
representing a project or community include using an official project e-mail
|
||||
address, posting via an official social media account, or acting as an appointed
|
||||
representative at an online or offline event. Representation of a project may be
|
||||
further defined and clarified by project maintainers.
|
||||
|
||||
## Enforcement
|
||||
|
||||
Instances of abusive, harassing, or otherwise unacceptable behavior
|
||||
may be reported by contacting stefan.prodan(at)gmail.com.
|
||||
All complaints will be reviewed and investigated and will result in a response that is deemed
|
||||
necessary and appropriate to the circumstances. The project team is
|
||||
obligated to maintain confidentiality with regard to the reporter of
|
||||
an incident. Further details of specific enforcement policies may be
|
||||
posted separately.
|
||||
|
||||
Project maintainers who do not follow or enforce the Code of Conduct in good
|
||||
faith may face temporary or permanent repercussions as determined by other
|
||||
members of the project's leadership.
|
||||
|
||||
## Attribution
|
||||
|
||||
This Code of Conduct is adapted from the [Contributor Covenant](https://www.contributor-covenant.org), version 1.4,
|
||||
available at https://www.contributor-covenant.org/version/1/4/code-of-conduct.html
|
||||
|
||||
|
Before Width: | Height: | Size: 30 KiB After Width: | Height: | Size: 36 KiB |
|
Before Width: | Height: | Size: 31 KiB After Width: | Height: | Size: 35 KiB |
|
Before Width: | Height: | Size: 220 KiB After Width: | Height: | Size: 40 KiB |
|
Before Width: | Height: | Size: 49 KiB After Width: | Height: | Size: 48 KiB |
|
Before Width: | Height: | Size: 36 KiB After Width: | Height: | Size: 33 KiB |
|
Before Width: | Height: | Size: 39 KiB After Width: | Height: | Size: 34 KiB |
|
Before Width: | Height: | Size: 40 KiB After Width: | Height: | Size: 38 KiB |
|
Before Width: | Height: | Size: 130 KiB After Width: | Height: | Size: 39 KiB |
|
Before Width: | Height: | Size: 32 KiB After Width: | Height: | Size: 40 KiB |
|
Before Width: | Height: | Size: 37 KiB After Width: | Height: | Size: 38 KiB |
|
Before Width: | Height: | Size: 35 KiB After Width: | Height: | Size: 38 KiB |
|
Before Width: | Height: | Size: 41 KiB After Width: | Height: | Size: 41 KiB |
|
Before Width: | Height: | Size: 38 KiB After Width: | Height: | Size: 41 KiB |
|
Before Width: | Height: | Size: 159 KiB After Width: | Height: | Size: 29 KiB |
|
Before Width: | Height: | Size: 39 KiB After Width: | Height: | Size: 38 KiB |
|
Before Width: | Height: | Size: 40 KiB After Width: | Height: | Size: 39 KiB |
|
Before Width: | Height: | Size: 49 KiB After Width: | Height: | Size: 48 KiB |
|
Before Width: | Height: | Size: 47 KiB After Width: | Height: | Size: 45 KiB |
BIN
docs/diagrams/flagger-traefik-overview.png
Normal file
|
After Width: | Height: | Size: 40 KiB |
@@ -4,29 +4,32 @@ description: Flagger is a progressive delivery Kubernetes operator
|
||||
|
||||
# Introduction
|
||||
|
||||
[Flagger](https://github.com/weaveworks/flagger) is a **Kubernetes** operator that automates the promotion of
|
||||
canary deployments using **Istio**, **Linkerd**, **App Mesh**, **NGINX**, **Skipper**, **Contour**, **Gloo** or **Traefik** routing for
|
||||
traffic shifting and **Prometheus** metrics for canary analysis. The canary analysis can be extended with webhooks for
|
||||
running system integration/acceptance tests, load tests, or any other custom validation.
|
||||
[Flagger](https://github.com/fluxcd/flagger) is a progressive delivery tool that automates the release
|
||||
process for applications running on Kubernetes. It reduces the risk of introducing a new software
|
||||
version in production by gradually shifting traffic to the new version while measuring metrics
|
||||
and running conformance tests.
|
||||
|
||||
Flagger implements a control loop that gradually shifts traffic to the canary while measuring key performance indicators
|
||||
like HTTP requests success rate, requests average duration and pods health.
|
||||
Based on analysis of the **KPIs** a canary is promoted or aborted, and the analysis result is published to **Slack** or **MS Teams**.
|
||||
Flagger implements several deployment strategies (Canary releases, A/B testing, Blue/Green mirroring)
|
||||
using a service mesh (App Mesh, Istio, Linkerd)
|
||||
or an ingress controller (Contour, Gloo, NGINX, Skipper, Traefik) for traffic routing.
|
||||
For release analysis, Flagger can query Prometheus, Datadog, New Relic or CloudWatch
|
||||
and for alerting it uses Slack, MS Teams, Discord and Rocket.
|
||||
|
||||

|
||||

|
||||
|
||||
Flagger can be configured with Kubernetes custom resources and is compatible with any CI/CD solutions made for Kubernetes.
|
||||
Since Flagger is declarative and reacts to Kubernetes events,
|
||||
it can be used in **GitOps** pipelines together with Flux CD or JenkinsX.
|
||||
Flagger can be configured with Kubernetes custom resources and is compatible with
|
||||
any CI/CD solutions made for Kubernetes. Since Flagger is declarative and reacts to Kubernetes events,
|
||||
it can be used in **GitOps** pipelines together with tools like Flux, JenkinsX, Carvel, Argo, etc.
|
||||
|
||||
This project is sponsored by [Weaveworks](https://www.weave.works/)
|
||||
Flagger is a [Cloud Native Computing Foundation](https://cncf.io/) project
|
||||
and part of [Flux](https://fluxcd.io) family of GitOps tools.
|
||||
|
||||
## Getting started
|
||||
|
||||
To get started with Flagger, chose one of the supported routing providers
|
||||
and [install](install/flagger-install-on-kubernetes.md) Flagger with Helm or Kustomize.
|
||||
To get started with Flagger, chose one of the supported routing providers and
|
||||
[install](install/flagger-install-on-kubernetes.md) Flagger with Helm or Kustomize.
|
||||
|
||||
After install Flagger, you can follow one of the tutorials:
|
||||
After install Flagger, you can follow one of these tutorials to get started:
|
||||
|
||||
**Service mesh tutorials**
|
||||
|
||||
|
||||
@@ -8,6 +8,7 @@
|
||||
* [Flagger Install on Kubernetes](install/flagger-install-on-kubernetes.md)
|
||||
* [Flagger Install on GKE Istio](install/flagger-install-on-google-cloud.md)
|
||||
* [Flagger Install on EKS App Mesh](install/flagger-install-on-eks-appmesh.md)
|
||||
* [Flagger Install on Alibaba ServiceMesh](install/flagger-install-on-alibaba-servicemesh.md)
|
||||
|
||||
## Usage
|
||||
|
||||
@@ -30,14 +31,12 @@
|
||||
* [Skipper Canary Deployments](tutorials/skipper-progressive-delivery.md)
|
||||
* [Traefik Canary Deployments](tutorials/traefik-progressive-delivery.md)
|
||||
* [Blue/Green Deployments](tutorials/kubernetes-blue-green.md)
|
||||
* [Crossover Canary Deployments](tutorials/crossover-progressive-delivery.md)
|
||||
* [Canary analysis with Prometheus Operator](tutorials/prometheus-operator.md)
|
||||
* [Canaries with Helm charts and GitOps](tutorials/canary-helm-gitops.md)
|
||||
* [Zero downtime deployments](tutorials/zero-downtime-deployments.md)
|
||||
* [Rollout Weights](tutorials/rollout-weights.md)
|
||||
|
||||
## Dev
|
||||
|
||||
* [Development Guide](dev/dev-guide.md)
|
||||
* [Release Guide](dev/release-guide.md)
|
||||
* [Upgrade Guide](dev/upgrade-guide.md)
|
||||
|
||||
|
||||
@@ -2,36 +2,36 @@
|
||||
|
||||
This document describes how to build, test and run Flagger from source.
|
||||
|
||||
### Setup dev environment
|
||||
## Setup dev environment
|
||||
|
||||
Flagger is written in Go and uses Go modules for dependency management.
|
||||
|
||||
On your dev machine install the following tools:
|
||||
* go >= 1.14
|
||||
* git >= 2.20
|
||||
* bash >= 5.0
|
||||
* make >= 3.81
|
||||
* kubectl >= 1.16
|
||||
* kustomize >= 3.5
|
||||
* helm >= 3.0
|
||||
* docker >= 19.03
|
||||
|
||||
* go >= 1.14
|
||||
* git >= 2.20
|
||||
* bash >= 5.0
|
||||
* make >= 3.81
|
||||
* kubectl >= 1.16
|
||||
* kustomize >= 3.5
|
||||
* helm >= 3.0
|
||||
* docker >= 19.03
|
||||
|
||||
You'll also need a Kubernetes cluster for testing Flagger.
|
||||
You can use Minikube, Kind, Docker desktop or any remote cluster
|
||||
(AKS/EKS/GKE/etc) Kubernetes version 1.14 or newer.
|
||||
You can use Minikube, Kind, Docker desktop or any remote cluster (AKS/EKS/GKE/etc) Kubernetes version 1.16 or newer.
|
||||
|
||||
To start contributing to Flagger, fork the [repository](https://github.com/weaveworks/flagger) on GitHub.
|
||||
To start contributing to Flagger, fork the [repository](https://github.com/fluxcd/flagger) on GitHub.
|
||||
|
||||
Create a dir inside your `GOPATH`:
|
||||
|
||||
```bash
|
||||
mkdir -p $GOPATH/src/github.com/weaveworks
|
||||
mkdir -p $GOPATH/src/github.com/fluxcd
|
||||
```
|
||||
|
||||
Clone your fork:
|
||||
|
||||
```bash
|
||||
cd $GOPATH/src/github.com/weaveworks
|
||||
cd $GOPATH/src/github.com/fluxcd
|
||||
git clone https://github.com/YOUR_USERNAME/flagger
|
||||
cd flagger
|
||||
```
|
||||
@@ -39,18 +39,18 @@ cd flagger
|
||||
Set Flagger repository as upstream:
|
||||
|
||||
```bash
|
||||
git remote add upstream https://github.com/weaveworks/flagger.git
|
||||
git remote add upstream https://github.com/fluxcd/flagger.git
|
||||
```
|
||||
|
||||
Sync your fork regularly to keep it up-to-date with upstream:
|
||||
|
||||
```bash
|
||||
git fetch upstream
|
||||
git checkout master
|
||||
git merge upstream/master
|
||||
git checkout main
|
||||
git merge upstream/main
|
||||
```
|
||||
|
||||
### Build
|
||||
## Build
|
||||
|
||||
Download Go modules:
|
||||
|
||||
@@ -58,19 +58,30 @@ Download Go modules:
|
||||
go mod download
|
||||
```
|
||||
|
||||
Build Flagger binary and container image:
|
||||
Build Flagger binary:
|
||||
|
||||
```bash
|
||||
make build
|
||||
```
|
||||
|
||||
Build load tester binary and container image:
|
||||
Build load tester binary:
|
||||
|
||||
```bash
|
||||
make loadtester-build
|
||||
```
|
||||
|
||||
### Code changes
|
||||
## Code changes
|
||||
|
||||
We require all commits to be signed. By signing off with your signature, you
|
||||
certify that you wrote the patch or otherwise have the right to contribute the
|
||||
material by the rules of the [DCO](https://raw.githubusercontent.com/fluxcd/flagger/main/DCO).
|
||||
|
||||
If your `user.name` and `user.email` are configured in your Git config,
|
||||
you can sign your commit automatically with:
|
||||
|
||||
```bash
|
||||
git commit -s
|
||||
```
|
||||
|
||||
Before submitting a PR, make sure your changes are covered by unit tests.
|
||||
|
||||
@@ -98,7 +109,7 @@ Run unit tests:
|
||||
make test
|
||||
```
|
||||
|
||||
### API changes
|
||||
## API changes
|
||||
|
||||
If you made changes to `pkg/apis` regenerate the Kubernetes client sets with:
|
||||
|
||||
@@ -114,10 +125,11 @@ make crd
|
||||
|
||||
Note that any change to the CRDs must be accompanied by an update to the Open API schema.
|
||||
|
||||
### Manual testing
|
||||
## Manual testing
|
||||
|
||||
Install a service mesh and/or an ingress controller on your cluster and deploy Flagger
|
||||
using one of the install options [listed here](https://docs.flagger.app/install/flagger-install-on-kubernetes).
|
||||
Install a service mesh and/or an ingress controller on your cluster
|
||||
and deploy Flagger using one of the install options
|
||||
[listed here](https://docs.flagger.app/install/flagger-install-on-kubernetes).
|
||||
|
||||
If you made changes to the CRDs, apply your local copy with:
|
||||
|
||||
@@ -150,7 +162,7 @@ Another option to manually test your changes is to build and push the image to y
|
||||
|
||||
```bash
|
||||
make build
|
||||
docker tag weaveworks/flagger:latest <YOUR-DOCKERHUB-USERNAME>/flagger:<YOUR-TAG>
|
||||
docker build -t <YOUR-DOCKERHUB-USERNAME>/flagger:<YOUR-TAG> .
|
||||
docker push <YOUR-DOCKERHUB-USERNAME>/flagger:<YOUR-TAG>
|
||||
```
|
||||
|
||||
@@ -163,7 +175,7 @@ kubectl -n istio-system scale deployment/flagger --replicas=1
|
||||
|
||||
Now you can use one of the [tutorials](https://docs.flagger.app/) to manually test your changes.
|
||||
|
||||
### Integration testing
|
||||
## Integration testing
|
||||
|
||||
Flagger end-to-end tests can be run locally with [Kubernetes Kind](https://github.com/kubernetes-sigs/kind).
|
||||
|
||||
@@ -173,39 +185,22 @@ Create a Kind cluster:
|
||||
kind create cluster
|
||||
```
|
||||
|
||||
Install a service mesh and/or an ingress controller in Kind.
|
||||
|
||||
Linkerd example:
|
||||
|
||||
```bash
|
||||
linkerd install | kubectl apply -f -
|
||||
linkerd check
|
||||
```
|
||||
|
||||
Build Flagger container image and load it on the cluster:
|
||||
|
||||
```bash
|
||||
make build
|
||||
docker tag weaveworks/flagger:latest test/flagger:latest
|
||||
docker build -t test/flagger:latest .
|
||||
kind load docker-image test/flagger:latest
|
||||
```
|
||||
|
||||
Install Flagger on the cluster and set the test image:
|
||||
|
||||
Run the Istio e2e tests:
|
||||
|
||||
```bash
|
||||
kubectl apply -k ./kustomize/linkerd
|
||||
kubectl -n linkerd set image deployment/flagger flagger=test/flagger:latest
|
||||
kubectl -n linkerd rollout status deployment/flagger
|
||||
```
|
||||
|
||||
Run the Linkerd e2e tests:
|
||||
|
||||
```bash
|
||||
./test/e2e-linkerd-tests.sh
|
||||
./test/istio/run.sh
|
||||
```
|
||||
|
||||
For each service mesh and ingress controller there is a dedicated e2e test suite,
|
||||
chose one that matches your changes from this [list](https://github.com/weaveworks/flagger/tree/master/test).
|
||||
chose one that matches your changes from this [list](https://github.com/fluxcd/flagger/tree/main/test).
|
||||
|
||||
When you open a pull request on Flagger repo, the unit and integration tests will be run in CI.
|
||||
|
||||
|
||||
@@ -2,33 +2,33 @@
|
||||
|
||||
This document describes how to release Flagger.
|
||||
|
||||
### Release
|
||||
## Release
|
||||
|
||||
To release a new Flagger version (e.g. `2.0.0`) follow these steps:
|
||||
|
||||
* create a branch `git checkout -b prep-2.0.0`
|
||||
* set the version in code and manifests `TAG=2.0.0 make version-set`
|
||||
* commit changes and merge PR
|
||||
* checkout master `git checkout master && git pull`
|
||||
* checkout master `git checkout main && git pull`
|
||||
* tag master `make release`
|
||||
|
||||
### CI
|
||||
## CI
|
||||
|
||||
After the tag has been pushed to GitHub, the CI release pipeline does the following:
|
||||
|
||||
* creates a GitHub release
|
||||
* pushes the Flagger binary and change log to GitHub release
|
||||
* pushes the Flagger container image to Docker Hub
|
||||
* pushes the Helm chart to github-pages branch
|
||||
* GitHub pages publishes the new chart version on the Helm repository
|
||||
|
||||
### Docs
|
||||
## Docs
|
||||
|
||||
The documentation [website](https://docs.flagger.app) is built from the `docs` branch.
|
||||
|
||||
After a Flagger release, publish the docs with:
|
||||
* `git checkout master && git pull`
|
||||
|
||||
* `git checkout main && git pull`
|
||||
* `git checkout docs`
|
||||
* `git rebase master`
|
||||
* `git rebase main`
|
||||
* `git push origin docs`
|
||||
|
||||
|
||||
|
||||
|
||||
@@ -2,9 +2,10 @@
|
||||
|
||||
This document describes how to upgrade Flagger.
|
||||
|
||||
### Upgrade canaries v1alpha3 to v1beta1
|
||||
## Upgrade canaries v1alpha3 to v1beta1
|
||||
|
||||
Canary CRD changes in `canaries.flagger.app/v1beta1`:
|
||||
|
||||
* the `spec.canaryAnalysis` field has been deprecated and replaced with `spec.analysis`
|
||||
* the `spec.analysis.interval` and `spec.analysis.threshold` fields are required
|
||||
* the `status.lastAppliedSpec` and `status.lastPromotedSpec` hashing algorithm changed to `hash/fnv`
|
||||
@@ -17,17 +18,17 @@ Canary CRD changes in `canaries.flagger.app/v1beta1`:
|
||||
* the `spec.service.meshName` field has been deprecated and no longer used for `provider: appmesh:v1beta2`
|
||||
|
||||
Upgrade procedure:
|
||||
|
||||
* install the `v1beta1` CRDs
|
||||
* update Flagger deployment
|
||||
* replace `apiVersion: flagger.app/v1alpha3` with `apiVersion: flagger.app/v1beta1` in all canary manifests
|
||||
* replace `spec.canaryAnalysis` with `spec.analysis` in all canary manifests
|
||||
* update canary manifests in cluster
|
||||
|
||||
**Note** that after upgrading Flagger, all canaries will be triggered as the hash value used for tracking changes
|
||||
is computed differently. You can set `spec.skipAnalysis: true` in all canary manifests before upgrading Flagger,
|
||||
do the upgrade, wait for Flagger to finish the no-op promotions and finally set `skipAnalysis` to `false`.
|
||||
**Note** that after upgrading Flagger, all canaries will be triggered as the hash value used for tracking changes is computed differently. You can set `spec.skipAnalysis: true` in all canary manifests before upgrading Flagger, do the upgrade, wait for Flagger to finish the no-op promotions and finally set `skipAnalysis` to `false`.
|
||||
|
||||
Update builtin metrics:
|
||||
|
||||
* replace `threshold` with `thresholdRange.min` for request-success-rate
|
||||
* replace `threshold` with `thresholdRange.max` for request-duration
|
||||
|
||||
@@ -43,11 +44,9 @@ metrics:
|
||||
interval: 1m
|
||||
```
|
||||
|
||||
### Istio telemetry v2
|
||||
## Istio telemetry v2
|
||||
|
||||
Istio 1.5 comes with a breaking change for Flagger uses. In Istio telemetry v2 the metric
|
||||
`istio_request_duration_seconds_bucket` has been removed and replaced with `istio_request_duration_milliseconds_bucket`
|
||||
and this breaks the `request-duration` metric check.
|
||||
Istio 1.5 comes with a breaking change for Flagger uses. In Istio telemetry v2 the metric `istio_request_duration_seconds_bucket` has been removed and replaced with `istio_request_duration_milliseconds_bucket` and this breaks the `request-duration` metric check.
|
||||
|
||||
If are using **Istio 1.4**, you can create a metric template using the old duration metric like this:
|
||||
|
||||
@@ -88,3 +87,4 @@ metrics:
|
||||
max: 0.500
|
||||
interval: 1m
|
||||
```
|
||||
|
||||
|
||||
@@ -1,32 +1,35 @@
|
||||
# Frequently asked questions
|
||||
# FAQ
|
||||
|
||||
### Deployment Strategies
|
||||
## Deployment Strategies
|
||||
|
||||
**Which deployment strategies are supported by Flagger?**
|
||||
#### Which deployment strategies are supported by Flagger?
|
||||
|
||||
Flagger implements the following deployment strategies:
|
||||
|
||||
* [Canary Release](usage/deployment-strategies.md#canary-release)
|
||||
* [A/B Testing](usage/deployment-strategies.md#a-b-testing)
|
||||
* [Blue/Green](usage/deployment-strategies.md#blue-green-deployments)
|
||||
* [Blue/Green Mirroring](usage/deployment-strategies.md#blue-green-with-traffic-mirroring)
|
||||
* [A/B Testing](usage/deployment-strategies.md#ab-testing)
|
||||
* [Blue/Green](usage/deployment-strategies.md#bluegreen-deployments)
|
||||
* [Blue/Green Mirroring](usage/deployment-strategies.md#bluegreen-with-traffic-mirroring)
|
||||
|
||||
**When should I use A/B testing instead of progressive traffic shifting?**
|
||||
#### When should I use A/B testing instead of progressive traffic shifting?
|
||||
|
||||
For frontend applications that require session affinity you should use HTTP headers or cookies match conditions
|
||||
to ensure a set of users will stay on the same version for the whole duration of the canary analysis.
|
||||
For frontend applications that require session affinity you should use HTTP headers or
|
||||
cookies match conditions to ensure a set of users will stay on the same version for
|
||||
the whole duration of the canary analysis.
|
||||
|
||||
**Can I use Flagger to manage applications that live outside of a service mesh?**
|
||||
#### Can I use Flagger to manage applications that live outside of a service mesh?
|
||||
|
||||
For applications that are not deployed on a service mesh, Flagger can orchestrate Blue/Green style deployments
|
||||
with Kubernetes L4 networking.
|
||||
For applications that are not deployed on a service mesh,
|
||||
Flagger can orchestrate Blue/Green style deployments with Kubernetes L4 networking.
|
||||
|
||||
**When can I use traffic mirroring?**
|
||||
#### When can I use traffic mirroring?
|
||||
|
||||
Traffic mirroring can be used for Blue/Green deployment strategy or a pre-stage in a Canary release.
|
||||
Traffic mirroring will copy each incoming request, sending one request to the primary and one to the canary service.
|
||||
Mirroring should be used for requests that are **idempotent** or capable of being processed twice (once by the primary and once by the canary).
|
||||
Mirroring should be used for requests that are **idempotent**
|
||||
or capable of being processed twice (once by the primary and once by the canary).
|
||||
|
||||
**How to retry a failed release?**
|
||||
#### How to retry a failed release?
|
||||
|
||||
A canary analysis is triggered by changes in any of the following objects:
|
||||
|
||||
@@ -46,9 +49,14 @@ spec:
|
||||
timestamp: "2020-03-10T14:24:48+0000"
|
||||
```
|
||||
|
||||
### Kubernetes services
|
||||
#### Why is there a downtime during the canary initializing process when analysis is disabled?
|
||||
|
||||
**How is an application exposed inside the cluster?**
|
||||
It is the intended behavior when the analysis is disabled, this allows instant rollback and also mimics the way a Kubernetes deployment initialization works.
|
||||
To avoid this: enable the analysis (`skipAnalysis: true`), wait for the initialization to finish, and disable it afterward (`skipAnalysis: false`).
|
||||
|
||||
## Kubernetes services
|
||||
|
||||
#### How is an application exposed inside the cluster?
|
||||
|
||||
Assuming the app name is podinfo you can define a canary like:
|
||||
|
||||
@@ -74,20 +82,26 @@ spec:
|
||||
portName: http
|
||||
```
|
||||
|
||||
If the `service.name` is not specified, then `targetRef.name` is used for the apex domain and canary/primary services name prefix.
|
||||
If the `service.name` is not specified, then `targetRef.name` is used for
|
||||
the apex domain and canary/primary services name prefix.
|
||||
You should treat the service name as an immutable field, changing it could result in routing conflicts.
|
||||
|
||||
Based on the canary spec service, Flagger generates the following Kubernetes ClusterIP service:
|
||||
|
||||
* `<service.name>.<namespace>.svc.cluster.local`
|
||||
|
||||
selector `app=<name>-primary`
|
||||
|
||||
* `<service.name>-primary.<namespace>.svc.cluster.local`
|
||||
|
||||
selector `app=<name>-primary`
|
||||
|
||||
* `<service.name>-canary.<namespace>.svc.cluster.local`
|
||||
|
||||
selector `app=<name>`
|
||||
|
||||
This ensures that traffic coming from a namespace outside the mesh to `podinfo.test:9898`
|
||||
will be routed to the latest stable release of your app.
|
||||
will be routed to the latest stable release of your app.
|
||||
|
||||
```yaml
|
||||
apiVersion: v1
|
||||
@@ -133,15 +147,15 @@ spec:
|
||||
targetPort: http
|
||||
```
|
||||
|
||||
The `podinfo-canary.test:9898` address is available only during the
|
||||
canary analysis and can be used for conformance testing or load testing.
|
||||
The `podinfo-canary.test:9898` address is available only during the canary analysis
|
||||
and can be used for conformance testing or load testing.
|
||||
|
||||
### Multiple ports
|
||||
## Multiple ports
|
||||
|
||||
**My application listens on multiple ports, how can I expose them inside the cluster?**
|
||||
#### My application listens on multiple ports, how can I expose them inside the cluster?
|
||||
|
||||
If port discovery is enabled, Flagger scans the deployment spec and extracts the containers
|
||||
ports excluding the port specified in the canary service and Envoy sidecar ports.
|
||||
If port discovery is enabled, Flagger scans the deployment spec and extracts the containers ports excluding
|
||||
the port specified in the canary service and Envoy sidecar ports.
|
||||
These ports will be used when generating the ClusterIP services.
|
||||
|
||||
For a deployment that exposes two ports:
|
||||
@@ -184,9 +198,9 @@ spec:
|
||||
|
||||
Both port `8080` and `9090` will be added to the ClusterIP services.
|
||||
|
||||
### Label selectors
|
||||
## Label selectors
|
||||
|
||||
**What labels selectors are supported by Flagger?**
|
||||
#### What labels selectors are supported by Flagger?
|
||||
|
||||
The target deployment must have a single label selector in the format `app: <DEPLOYMENT-NAME>`:
|
||||
|
||||
@@ -205,14 +219,86 @@ spec:
|
||||
app: podinfo
|
||||
```
|
||||
|
||||
Besides `app` Flagger supports `name` and `app.kubernetes.io/name` selectors. If you use a different
|
||||
convention you can specify your label with the `-selector-labels` flag.
|
||||
Besides `app` Flagger supports `name` and `app.kubernetes.io/name` selectors.
|
||||
If you use a different convention you can specify your label with the `-selector-labels` flag.
|
||||
|
||||
**Is pod affinity and anti affinity supported?**
|
||||
#### Is pod affinity and anti affinity supported?
|
||||
|
||||
For pod affinity to work you need to use a different label than the `app`, `name` or `app.kubernetes.io/name`.
|
||||
Flagger will rewrite the first value in each match expression,
|
||||
defined in the target deployment's pod anti-affinity and topology spread constraints,
|
||||
satisfying the following two requirements when creating, or updating, the primary deployment:
|
||||
|
||||
Anti affinity example:
|
||||
* The key in the match expression must be one of the labels specified by the parameter selector-labels.
|
||||
The default labels are `app`,`name`,`app.kubernetes.io/name`.
|
||||
* The value must match the name of the target deployment.
|
||||
|
||||
The rewrite done by Flagger in these cases is to suffix the value with `-primary`.
|
||||
This rewrite can be used to spread the pods created by the canary
|
||||
and primary deployments across different availability zones.
|
||||
|
||||
Example target deployment:
|
||||
|
||||
```yaml
|
||||
apiVersion: apps/v1
|
||||
kind: Deployment
|
||||
metadata:
|
||||
name: podinfo
|
||||
spec:
|
||||
selector:
|
||||
matchLabels:
|
||||
app: podinfo
|
||||
template:
|
||||
metadata:
|
||||
labels:
|
||||
app: podinfo
|
||||
spec:
|
||||
affinity:
|
||||
podAntiAffinity:
|
||||
preferredDuringSchedulingIgnoredDuringExecution:
|
||||
- weight: 100
|
||||
podAffinityTerm:
|
||||
labelSelector:
|
||||
matchExpressions:
|
||||
- key: app
|
||||
operator: In
|
||||
values:
|
||||
- podinfo
|
||||
topologyKey: topology.kubernetes.io/zone
|
||||
```
|
||||
|
||||
Example of generated primary deployment:
|
||||
|
||||
```yaml
|
||||
apiVersion: apps/v1
|
||||
kind: Deployment
|
||||
metadata:
|
||||
name: podinfo-primary
|
||||
spec:
|
||||
selector:
|
||||
matchLabels:
|
||||
app: podinfo-primary
|
||||
template:
|
||||
metadata:
|
||||
labels:
|
||||
app: podinfo-primary
|
||||
spec:
|
||||
affinity:
|
||||
podAntiAffinity:
|
||||
preferredDuringSchedulingIgnoredDuringExecution:
|
||||
- weight: 100
|
||||
podAffinityTerm:
|
||||
labelSelector:
|
||||
matchExpressions:
|
||||
- key: app
|
||||
operator: In
|
||||
values:
|
||||
- podinfo-primary
|
||||
topologyKey: topology.kubernetes.io/zone
|
||||
```
|
||||
|
||||
It is also possible to use a different label than the `app`, `name` or `app.kubernetes.io/name`.
|
||||
|
||||
Anti affinity example(using a different label):
|
||||
|
||||
```yaml
|
||||
apiVersion: apps/v1
|
||||
@@ -238,16 +324,16 @@ spec:
|
||||
labelSelector:
|
||||
matchLabels:
|
||||
affinity: podinfo
|
||||
topologyKey: kubernetes.io/hostname
|
||||
topologyKey: topology.kubernetes.io/zone
|
||||
```
|
||||
|
||||
### Metrics
|
||||
## Metrics
|
||||
|
||||
**How does Flagger measures the request success rate and duration?**
|
||||
#### How does Flagger measure the request success rate and duration?
|
||||
|
||||
Flagger measures the request success rate and duration using Prometheus queries.
|
||||
|
||||
**HTTP requests success rate percentage**
|
||||
#### HTTP requests success rate percentage
|
||||
|
||||
Spec:
|
||||
|
||||
@@ -310,28 +396,28 @@ sum(
|
||||
)
|
||||
```
|
||||
|
||||
Envoy query (Contour or Gloo):
|
||||
Envoy query (Contour and Gloo):
|
||||
|
||||
```javascript
|
||||
sum(
|
||||
rate(
|
||||
envoy_cluster_upstream_rq{
|
||||
envoy_cluster_name=~"$namespace-$workload",
|
||||
envoy_response_code!~"5.*"
|
||||
}[$interval]
|
||||
)
|
||||
rate(
|
||||
envoy_cluster_upstream_rq{
|
||||
envoy_cluster_name=~"$namespace-$workload",
|
||||
envoy_response_code!~"5.*"
|
||||
}[$interval]
|
||||
)
|
||||
)
|
||||
/
|
||||
sum(
|
||||
rate(
|
||||
envoy_cluster_upstream_rq{
|
||||
envoy_cluster_name=~"$namespace-$workload",
|
||||
}[$interval]
|
||||
)
|
||||
rate(
|
||||
envoy_cluster_upstream_rq{
|
||||
envoy_cluster_name=~"$namespace-$workload",
|
||||
}[$interval]
|
||||
)
|
||||
)
|
||||
```
|
||||
|
||||
**HTTP requests milliseconds duration P99**
|
||||
#### HTTP requests milliseconds duration P99
|
||||
|
||||
Spec:
|
||||
|
||||
@@ -362,7 +448,7 @@ histogram_quantile(0.99,
|
||||
)
|
||||
```
|
||||
|
||||
Envoy query (App Mesh, Contour or Gloo):
|
||||
Envoy query (App Mesh, Contour and Gloo):
|
||||
|
||||
```javascript
|
||||
histogram_quantile(0.99,
|
||||
@@ -379,20 +465,20 @@ histogram_quantile(0.99,
|
||||
|
||||
> **Note** that the metric interval should be lower or equal to the control loop interval.
|
||||
|
||||
**Can I use custom metrics?**
|
||||
#### Can I use custom metrics?
|
||||
|
||||
The analysis can be extended with metrics provided by Prometheus, Datadog and AWS CloudWatch. For more details
|
||||
on how custom metrics can be used please read the [metrics docs](usage/metrics.md).
|
||||
The analysis can be extended with metrics provided by Prometheus, Datadog and AWS CloudWatch.
|
||||
For more details on how custom metrics can be used please read the [metrics docs](usage/metrics.md).
|
||||
|
||||
### Istio routing
|
||||
## Istio routing
|
||||
|
||||
**How does Flagger interact with Istio?**
|
||||
#### How does Flagger interact with Istio?
|
||||
|
||||
Flagger creates an Istio Virtual Service and Destination Rules based on the Canary service spec.
|
||||
The service configuration lets you expose an app inside or outside the mesh.
|
||||
You can also define traffic policies, HTTP match conditions, URI rewrite rules, CORS policies, timeout and retries.
|
||||
Flagger creates an Istio Virtual Service and Destination Rules based on the Canary service spec.
|
||||
The service configuration lets you expose an app inside or outside the mesh. You can also define traffic policies,
|
||||
HTTP match conditions, URI rewrite rules, CORS policies, timeout and retries.
|
||||
|
||||
The following spec exposes the `frontend` workload inside the mesh on `frontend.test.svc.cluster.local:9898`
|
||||
The following spec exposes the `frontend` workload inside the mesh on `frontend.test.svc.cluster.local:9898`
|
||||
and outside the mesh on `frontend.example.com`. You'll have to specify an Istio ingress gateway for external hosts.
|
||||
|
||||
```yaml
|
||||
@@ -572,8 +658,8 @@ spec:
|
||||
app: backend-primary
|
||||
```
|
||||
|
||||
Flagger works for user facing apps exposed outside the cluster via an ingress gateway
|
||||
and for backend HTTP APIs that are accessible only from inside the mesh.
|
||||
Flagger works for user facing apps exposed outside the cluster via an ingress gateway and for backend HTTP APIs
|
||||
that are accessible only from inside the mesh.
|
||||
|
||||
If `Delegation` is enabled, Flagger would generate Istio VirtualService without hosts and gateway,
|
||||
making the service compatible with Istio delegation.
|
||||
@@ -651,12 +737,14 @@ spec:
|
||||
namespace: test
|
||||
```
|
||||
|
||||
Note that pilot env `PILOT_ENABLE_VIRTUAL_SERVICE_DELEGATE` must also be set.
|
||||
(For the use of Istio Delegation, you can refer to the documentation of [Virtual Service](https://istio.io/latest/docs/reference/config/networking/virtual-service/#Delegate) and [pilot environment variables](https://istio.io/latest/docs/reference/commands/pilot-discovery/#envvars).)
|
||||
Note that pilot env `PILOT_ENABLE_VIRTUAL_SERVICE_DELEGATE` must also be set.
|
||||
For the use of Istio Delegation, you can refer to the documentation of
|
||||
[Virtual Service](https://istio.io/latest/docs/reference/config/networking/virtual-service/#Delegate)
|
||||
and [pilot environment variables](https://istio.io/latest/docs/reference/commands/pilot-discovery/#envvars).
|
||||
|
||||
### Istio Ingress Gateway
|
||||
## Istio Ingress Gateway
|
||||
|
||||
**How can I expose multiple canaries on the same external domain?**
|
||||
#### How can I expose multiple canaries on the same external domain?
|
||||
|
||||
Assuming you have two apps, one that servers the main website and one that serves the REST API.
|
||||
For each app you can define a canary object as:
|
||||
@@ -697,15 +785,17 @@ spec:
|
||||
uri: /
|
||||
```
|
||||
|
||||
Based on the above configuration, Flagger will create two virtual services bounded to the same ingress gateway and external host.
|
||||
Istio Pilot will [merge](https://istio.io/help/ops/traffic-management/deploy-guidelines/#multiple-virtual-services-and-destination-rules-for-the-same-host)
|
||||
the two services and the website rule will be moved to the end of the list in the merged configuration.
|
||||
Based on the above configuration, Flagger will create two virtual services bounded
|
||||
to the same ingress gateway and external host.
|
||||
Istio Pilot will
|
||||
[merge](https://istio.io/help/ops/traffic-management/deploy-guidelines/#multiple-virtual-services-and-destination-rules-for-the-same-host)
|
||||
the two services and the website rule will be moved to the end of the list in the merged configuration.
|
||||
|
||||
Note that host merging only works if the canaries are bounded to a ingress gateway other than the `mesh` gateway.
|
||||
|
||||
### Istio Mutual TLS
|
||||
## Istio Mutual TLS
|
||||
|
||||
**How can I enable mTLS for a canary?**
|
||||
#### How can I enable mTLS for a canary?
|
||||
|
||||
When deploying Istio with global mTLS enabled, you have to set the TLS mode to `ISTIO_MUTUAL`:
|
||||
|
||||
@@ -731,12 +821,13 @@ spec:
|
||||
mode: DISABLE
|
||||
```
|
||||
|
||||
**If Flagger is outside of the mesh, how can it start the load test?**
|
||||
#### If Flagger is outside of the mesh, how can it start the load test?
|
||||
|
||||
In order for Flagger to be able to call the load tester service from outside the mesh, you need to disable mTLS on port 80:
|
||||
In order for Flagger to be able to call the load tester service from outside the mesh,
|
||||
you need to disable mTLS:
|
||||
|
||||
```yaml
|
||||
apiVersion: networking.istio.io/v1alpha3
|
||||
apiVersion: networking.istio.io/v1beta1
|
||||
kind: DestinationRule
|
||||
metadata:
|
||||
name: flagger-loadtester
|
||||
@@ -747,14 +838,15 @@ spec:
|
||||
tls:
|
||||
mode: DISABLE
|
||||
---
|
||||
apiVersion: authentication.istio.io/v1alpha1
|
||||
kind: Policy
|
||||
apiVersion: security.istio.io/v1beta1
|
||||
kind: PeerAuthentication
|
||||
metadata:
|
||||
name: flagger-loadtester
|
||||
namespace: test
|
||||
spec:
|
||||
targets:
|
||||
- name: flagger-loadtester
|
||||
ports:
|
||||
- number: 80
|
||||
selector:
|
||||
matchLabels:
|
||||
app: flagger-loadtester
|
||||
mtls:
|
||||
mode: DISABLE
|
||||
```
|
||||
|
||||
136
docs/gitbook/install/flagger-install-on-alibaba-servicemesh.md
Normal file
@@ -0,0 +1,136 @@
|
||||
# Flagger Install on Alibaba ServiceMesh
|
||||
|
||||
This guide walks you through setting up Flagger on Alibaba ServiceMesh.
|
||||
|
||||
## Prerequisites
|
||||
- Created an ACK([Alibabacloud Container Service for Kubernetes](https://cs.console.aliyun.com)) cluster instance.
|
||||
- Created an ASM([Alibaba ServiceMesh](https://servicemesh.console.aliyun.com)) instance, and added ACK cluster.
|
||||
|
||||
### Variables declaration
|
||||
- `$ACK_CONFIG`: the kubeconfig file path of ACK, which be treated as`$HOME/.kube/config` in the rest of guide.
|
||||
- `$MESH_CONFIG`: the kubeconfig file path of ASM.
|
||||
- `$ISTIO_RELEASE`: see https://github.com/istio/istio/releases
|
||||
- `$FLAGGER_SRC`: see https://github.com/fluxcd/flagger
|
||||
|
||||
## Install Prometheus
|
||||
Install Prometheus:
|
||||
|
||||
```bash
|
||||
kubectl apply -f $ISTIO_RELEASE/samples/addons/prometheus.yaml
|
||||
```
|
||||
|
||||
it' same with the below cmd:
|
||||
|
||||
```bash
|
||||
kubectl --kubeconfig "$ACK_CONFIG" apply -f $ISTIO_RELEASE/samples/addons/prometheus.yaml
|
||||
```
|
||||
|
||||
Append the below configs to `scrape_configs` in prometheus configmap, to support telemetry:
|
||||
```yaml
|
||||
scrape_configs:
|
||||
# Mixer scrapping. Defaults to Prometheus and mixer on same namespace.
|
||||
- job_name: 'istio-mesh'
|
||||
kubernetes_sd_configs:
|
||||
- role: endpoints
|
||||
namespaces:
|
||||
names:
|
||||
- istio-system
|
||||
relabel_configs:
|
||||
- source_labels: [__meta_kubernetes_service_name, __meta_kubernetes_endpoint_port_name]
|
||||
action: keep
|
||||
regex: istio-telemetry;prometheus
|
||||
# Scrape config for envoy stats
|
||||
- job_name: 'envoy-stats'
|
||||
metrics_path: /stats/prometheus
|
||||
kubernetes_sd_configs:
|
||||
- role: pod
|
||||
relabel_configs:
|
||||
- source_labels: [__meta_kubernetes_pod_container_port_name]
|
||||
action: keep
|
||||
regex: '.*-envoy-prom'
|
||||
- source_labels: [__address__, __meta_kubernetes_pod_annotation_prometheus_io_port]
|
||||
action: replace
|
||||
regex: ([^:]+)(?::\d+)?;(\d+)
|
||||
replacement: $1:15090
|
||||
target_label: __address__
|
||||
- action: labeldrop
|
||||
regex: __meta_kubernetes_pod_label_(.+)
|
||||
- source_labels: [__meta_kubernetes_namespace]
|
||||
action: replace
|
||||
target_label: namespace
|
||||
- source_labels: [__meta_kubernetes_pod_name]
|
||||
action: replace
|
||||
target_label: pod_name
|
||||
- job_name: 'istio-policy'
|
||||
kubernetes_sd_configs:
|
||||
- role: endpoints
|
||||
namespaces:
|
||||
names:
|
||||
- istio-system
|
||||
relabel_configs:
|
||||
- source_labels: [__meta_kubernetes_service_name, __meta_kubernetes_endpoint_port_name]
|
||||
action: keep
|
||||
regex: istio-policy;http-policy-monitoring
|
||||
- job_name: 'istio-telemetry'
|
||||
kubernetes_sd_configs:
|
||||
- role: endpoints
|
||||
namespaces:
|
||||
names:
|
||||
- istio-system
|
||||
relabel_configs:
|
||||
- source_labels: [__meta_kubernetes_service_name, __meta_kubernetes_endpoint_port_name]
|
||||
action: keep
|
||||
regex: istio-telemetry;http-monitoring
|
||||
- job_name: 'pilot'
|
||||
kubernetes_sd_configs:
|
||||
- role: endpoints
|
||||
namespaces:
|
||||
names:
|
||||
- istio-system
|
||||
relabel_configs:
|
||||
- source_labels: [__meta_kubernetes_service_name, __meta_kubernetes_endpoint_port_name]
|
||||
action: keep
|
||||
regex: istiod;http-monitoring
|
||||
- source_labels: [__meta_kubernetes_service_label_app]
|
||||
target_label: app
|
||||
- job_name: 'sidecar-injector'
|
||||
kubernetes_sd_configs:
|
||||
- role: endpoints
|
||||
namespaces:
|
||||
names:
|
||||
- istio-system
|
||||
relabel_configs:
|
||||
- source_labels: [__meta_kubernetes_service_name, __meta_kubernetes_endpoint_port_name]
|
||||
action: keep
|
||||
regex: istio-sidecar-injector;http-monitoring
|
||||
```
|
||||
|
||||
## Install Flagger
|
||||
|
||||
Add Flagger Helm repository:
|
||||
|
||||
```bash
|
||||
helm repo add flagger https://flagger.app
|
||||
helm repo update
|
||||
```
|
||||
|
||||
Install Flagger's Canary CRD:
|
||||
|
||||
```yaml
|
||||
kubectl apply -f $FLAGGER_SRC/artifacts/flagger/crd.yaml
|
||||
```
|
||||
|
||||
Deploy Flagger for Alibaba ServiceMesh:
|
||||
|
||||
```bash
|
||||
cp $MESH_CONFIG kubeconfig
|
||||
kubectl -n istio-system create secret generic istio-kubeconfig --from-file kubeconfig
|
||||
kubectl -n istio-system label secret istio-kubeconfig istio/multiCluster=true
|
||||
helm upgrade -i flagger flagger/flagger \
|
||||
--namespace=istio-system \
|
||||
--set crd.create=false \
|
||||
--set meshProvider=istio \
|
||||
--set metricsServer=http://prometheus:9090 \
|
||||
--set istio.kubeconfig.secretName=istio-kubeconfig \
|
||||
--set istio.kubeconfig.key=kubeconfig
|
||||
```
|
||||
@@ -62,7 +62,7 @@ helm repo add eks https://aws.github.io/eks-charts
|
||||
|
||||
## Enable horizontal pod auto-scaling
|
||||
|
||||
Install the Horizontal Pod Autoscaler \(HPA\) metrics provider:
|
||||
Install the Horizontal Pod Autoscaler (HPA) metrics provider:
|
||||
|
||||
```bash
|
||||
helm upgrade -i metrics-server stable/metrics-server \
|
||||
@@ -118,7 +118,7 @@ helm repo add flagger https://flagger.app
|
||||
Install Flagger's Canary CRD:
|
||||
|
||||
```yaml
|
||||
kubectl apply -f https://raw.githubusercontent.com/weaveworks/flagger/master/artifacts/flagger/crd.yaml
|
||||
kubectl apply -f https://raw.githubusercontent.com/fluxcd/flagger/main/artifacts/flagger/crd.yaml
|
||||
```
|
||||
|
||||
Deploy Flagger in the _**appmesh-system**_ namespace:
|
||||
@@ -146,6 +146,6 @@ You can access Grafana using port forwarding:
|
||||
kubectl -n appmesh-system port-forward svc/appmesh-grafana 3000:3000
|
||||
```
|
||||
|
||||
Now that you have Flagger running,
|
||||
you can try the [App Mesh canary deployments tutorial](https://docs.flagger.app/usage/appmesh-progressive-delivery).
|
||||
Now that you have Flagger running, you can try the
|
||||
[App Mesh canary deployments tutorial](https://docs.flagger.app/usage/appmesh-progressive-delivery).
|
||||
|
||||
|
||||
@@ -2,7 +2,7 @@
|
||||
|
||||
This guide walks you through setting up Flagger and Istio on Google Kubernetes Engine.
|
||||
|
||||

|
||||
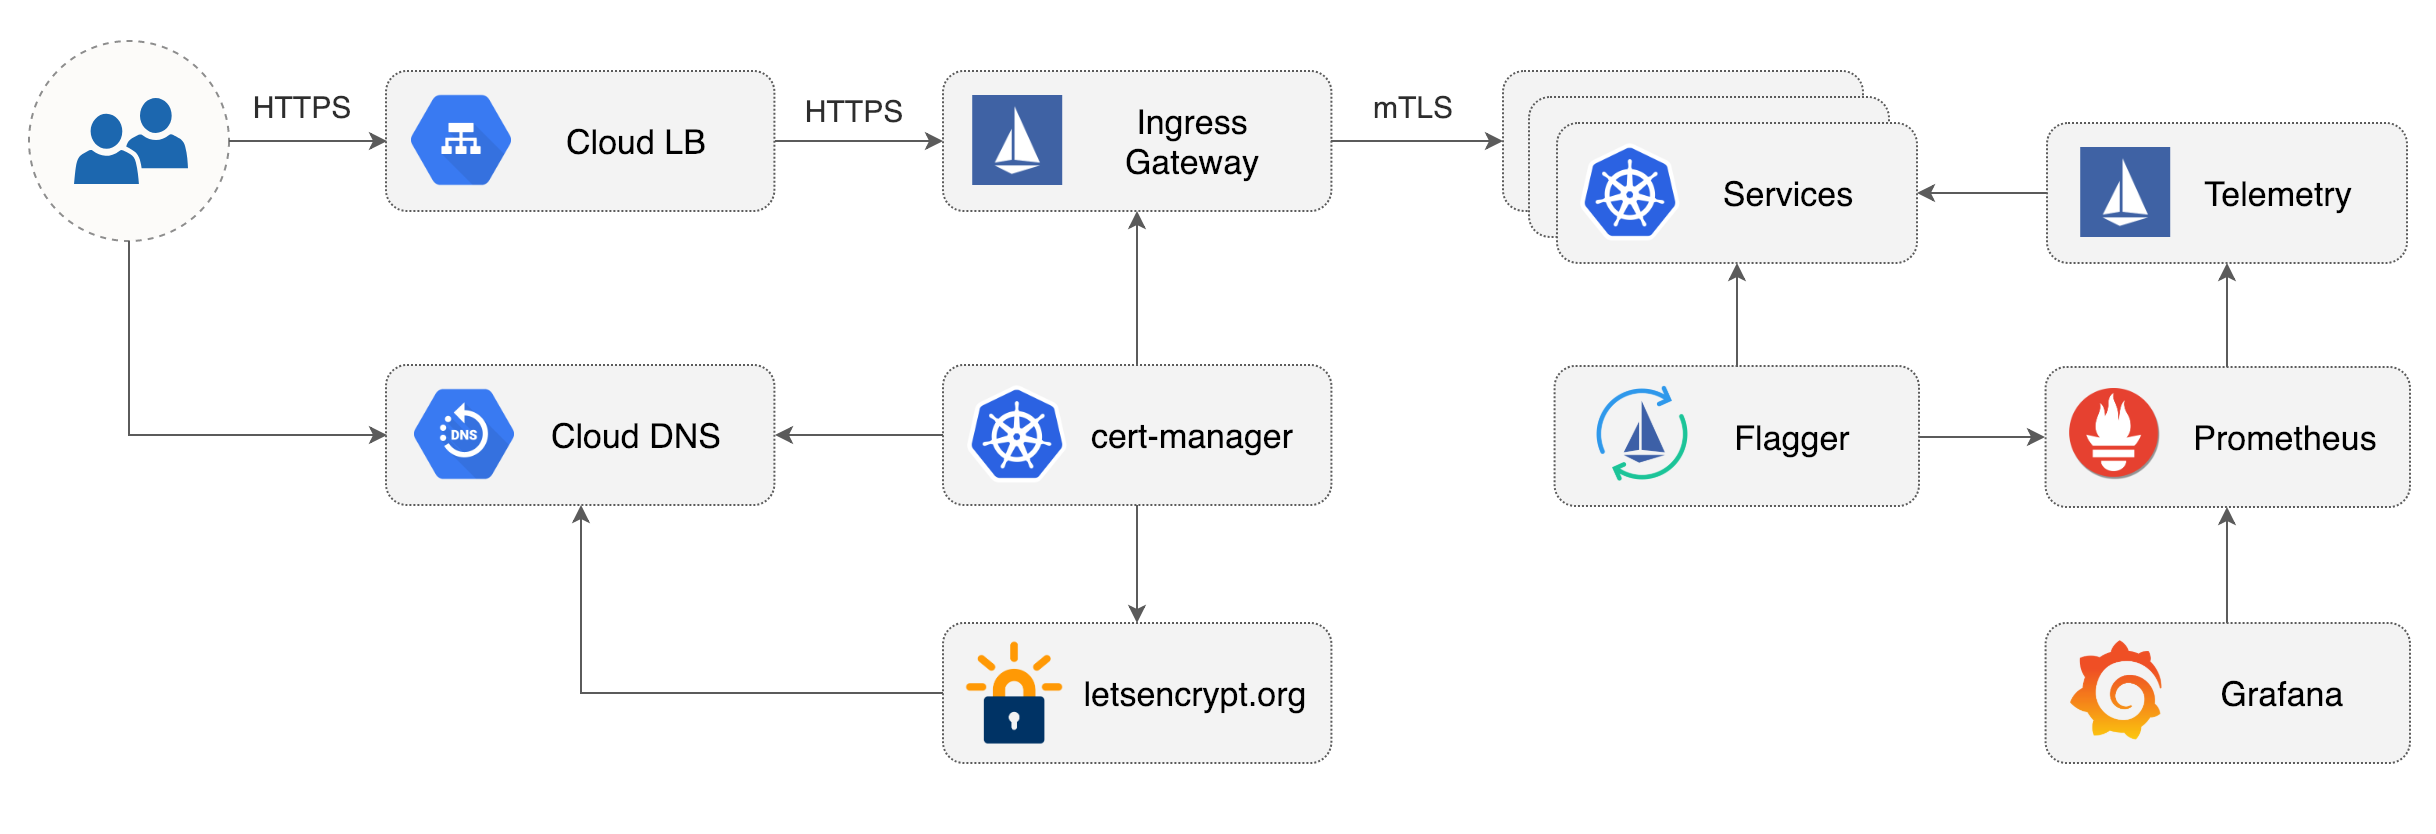
|
||||
|
||||
## Prerequisites
|
||||
|
||||
@@ -205,12 +205,12 @@ jetstack/cert-manager
|
||||
|
||||
## Istio Gateway TLS setup
|
||||
|
||||
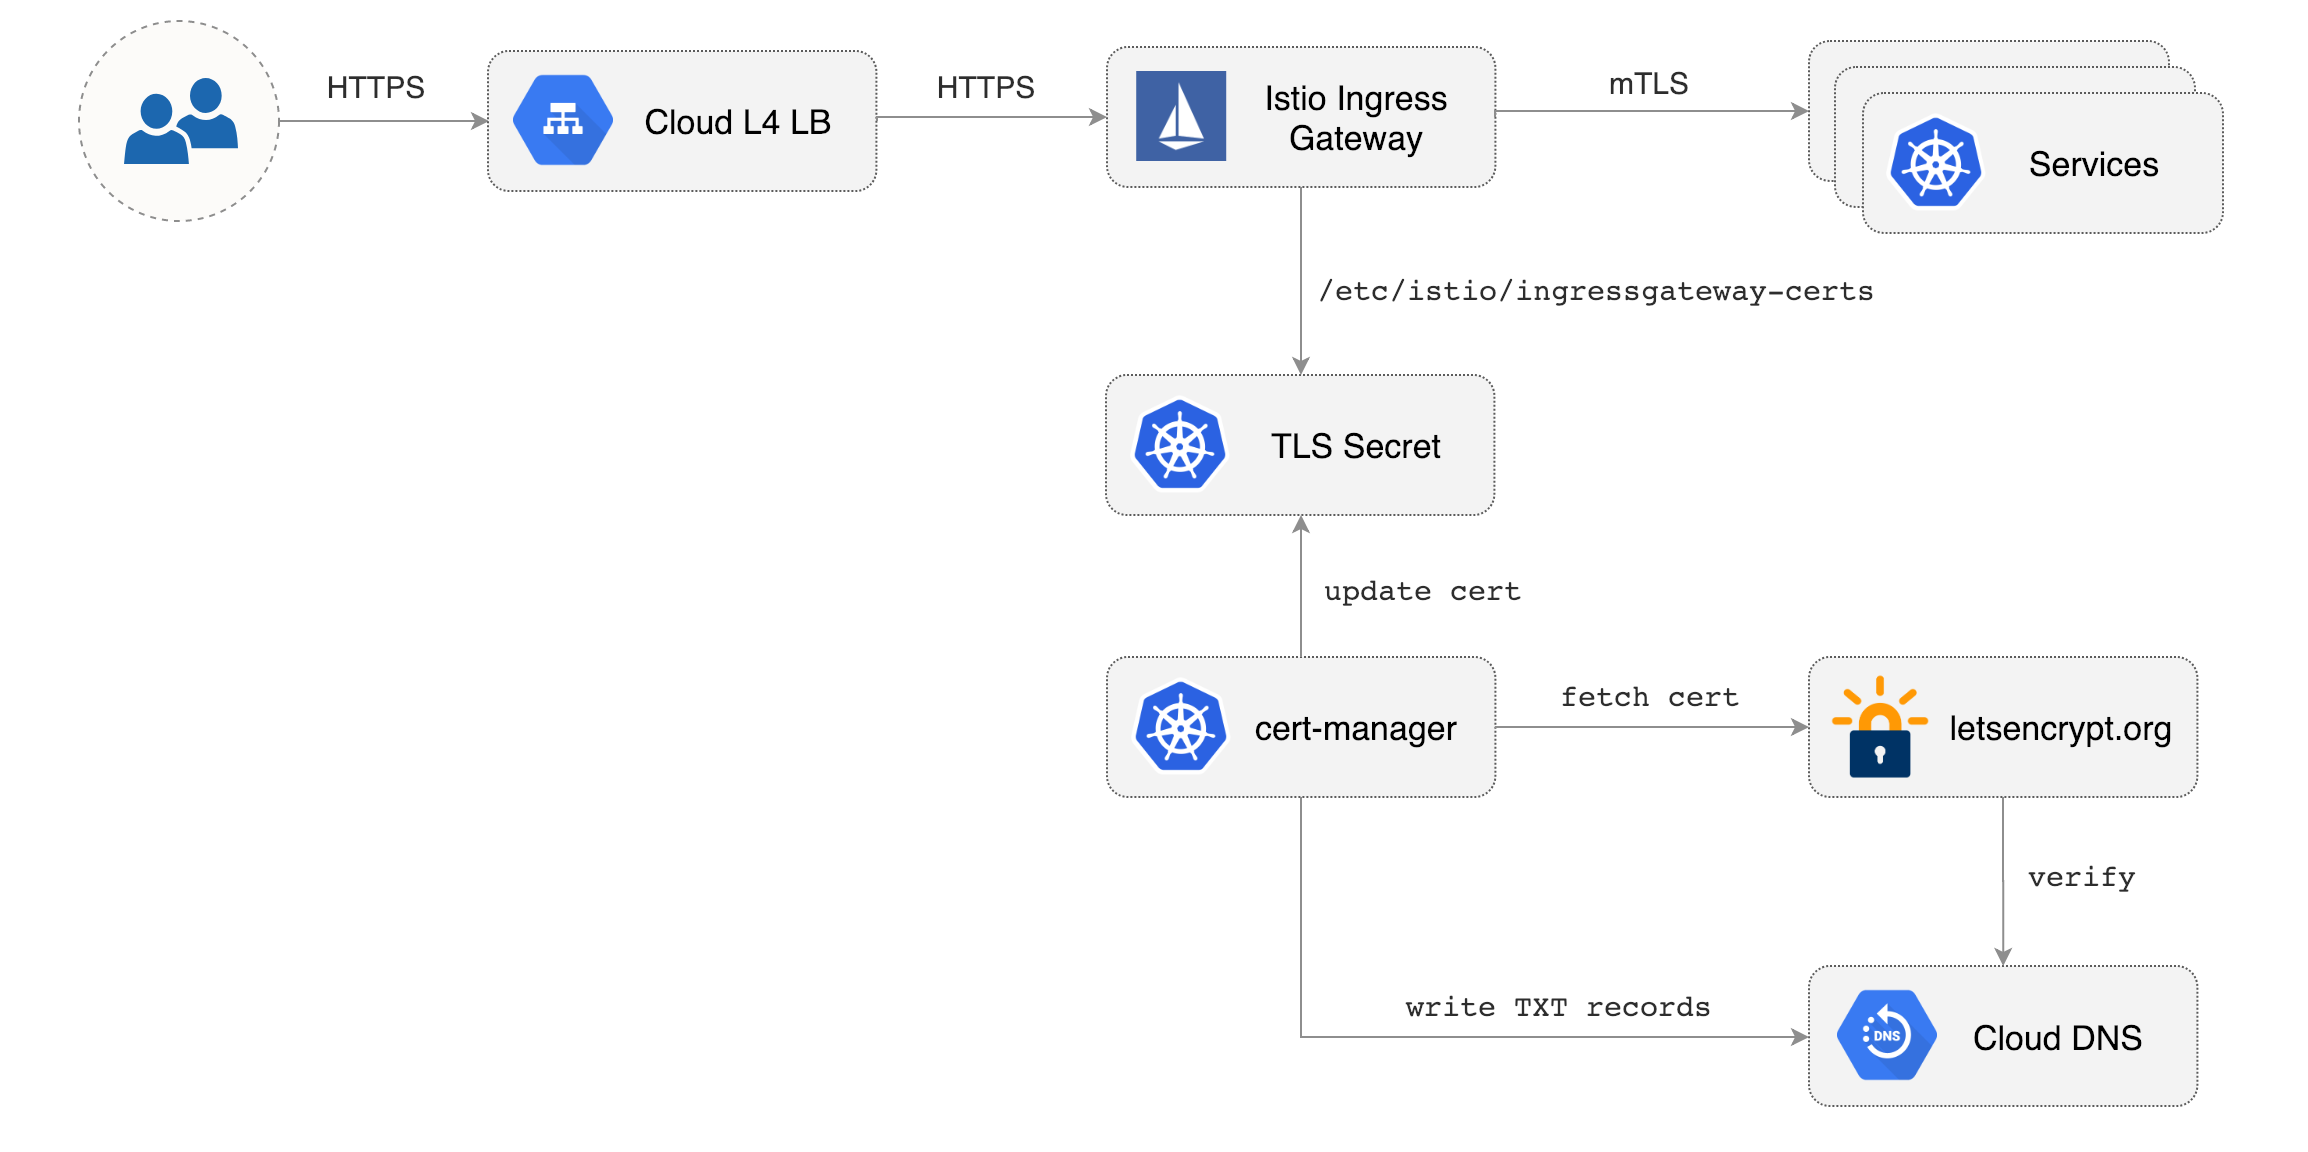
|
||||

|
||||
|
||||
Create a generic Istio Gateway to expose services outside the mesh on HTTPS:
|
||||
|
||||
```bash
|
||||
REPO=https://raw.githubusercontent.com/weaveworks/flagger/master
|
||||
REPO=https://raw.githubusercontent.com/fluxcd/flagger/main
|
||||
|
||||
kubectl apply -f ${REPO}/artifacts/gke/istio-gateway.yaml
|
||||
```
|
||||
@@ -346,7 +346,7 @@ helm repo add flagger https://flagger.app
|
||||
Install Flagger's Canary CRD:
|
||||
|
||||
```yaml
|
||||
kubectl apply -f https://raw.githubusercontent.com/weaveworks/flagger/master/artifacts/flagger/crd.yaml
|
||||
kubectl apply -f https://raw.githubusercontent.com/fluxcd/flagger/main/artifacts/flagger/crd.yaml
|
||||
```
|
||||
|
||||
Deploy Flagger in the `istio-system` namespace with Slack notifications enabled:
|
||||
|
||||
@@ -4,7 +4,7 @@ This guide walks you through setting up Flagger on a Kubernetes cluster with Hel
|
||||
|
||||
## Prerequisites
|
||||
|
||||
Flagger requires a Kubernetes cluster **v1.14** or newer.
|
||||
Flagger requires a Kubernetes cluster **v1.16** or newer.
|
||||
|
||||
## Install Flagger with Helm
|
||||
|
||||
@@ -17,7 +17,7 @@ helm repo add flagger https://flagger.app
|
||||
Install Flagger's Canary CRD:
|
||||
|
||||
```yaml
|
||||
kubectl apply -f https://raw.githubusercontent.com/weaveworks/flagger/master/artifacts/flagger/crd.yaml
|
||||
kubectl apply -f https://raw.githubusercontent.com/fluxcd/flagger/main/artifacts/flagger/crd.yaml
|
||||
```
|
||||
|
||||
Deploy Flagger for Istio:
|
||||
@@ -30,11 +30,12 @@ helm upgrade -i flagger flagger/flagger \
|
||||
--set metricsServer=http://prometheus:9090
|
||||
```
|
||||
|
||||
Note that Flagger depends on Istio telemetry and Prometheus, if you're installing Istio with istioctl
|
||||
then you should be using the [default profile](https://istio.io/docs/setup/additional-setup/config-profiles/).
|
||||
Note that Flagger depends on Istio telemetry and Prometheus, if you're installing
|
||||
Istio with istioctl then you should be using the
|
||||
[default profile](https://istio.io/docs/setup/additional-setup/config-profiles/).
|
||||
|
||||
For Istio multi-cluster shared control plane you can install Flagger
|
||||
on each remote cluster and set the Istio control plane host cluster kubeconfig:
|
||||
For Istio multi-cluster shared control plane you can install Flagger on each remote cluster and set the
|
||||
Istio control plane host cluster kubeconfig:
|
||||
|
||||
```bash
|
||||
helm upgrade -i flagger flagger/flagger \
|
||||
@@ -47,8 +48,8 @@ helm upgrade -i flagger flagger/flagger \
|
||||
```
|
||||
|
||||
Note that the Istio kubeconfig must be stored in a Kubernetes secret with a data key named `kubeconfig`.
|
||||
For more details on how to configure Istio multi-cluster credentials
|
||||
read the [Istio docs](https://istio.io/docs/setup/install/multicluster/shared-vpn/#credentials).
|
||||
For more details on how to configure Istio multi-cluster
|
||||
credentials read the [Istio docs](https://istio.io/docs/setup/install/multicluster/shared-vpn/#credentials).
|
||||
|
||||
Deploy Flagger for Linkerd:
|
||||
|
||||
@@ -80,26 +81,6 @@ For ingress controllers, the install instructions are:
|
||||
* [Skipper](https://docs.flagger.app/tutorials/skipper-progressive-delivery)
|
||||
* [Traefik](https://docs.flagger.app/tutorials/traefik-progressive-delivery)
|
||||
|
||||
Enable **Slack** notifications:
|
||||
|
||||
```bash
|
||||
helm upgrade -i flagger flagger/flagger \
|
||||
--namespace=istio-system \
|
||||
--set crd.create=false \
|
||||
--set slack.url=https://hooks.slack.com/services/YOUR/SLACK/WEBHOOK \
|
||||
--set slack.channel=general \
|
||||
--set slack.user=flagger
|
||||
```
|
||||
|
||||
Enable **Microsoft Teams** notifications:
|
||||
|
||||
```bash
|
||||
helm upgrade -i flagger flagger/flagger \
|
||||
--namespace=istio-system \
|
||||
--set crd.create=false \
|
||||
--set msteams.url=https://outlook.office.com/webhook/YOUR/TEAMS/WEBHOOK
|
||||
```
|
||||
|
||||
You can use the helm template command and apply the generated yaml with kubectl:
|
||||
|
||||
```bash
|
||||
@@ -123,7 +104,7 @@ helm delete flagger
|
||||
The command removes all the Kubernetes components associated with the chart and deletes the release.
|
||||
|
||||
> **Note** that on uninstall the Canary CRD will not be removed. Deleting the CRD will make Kubernetes
|
||||
>remove all the objects owned by Flagger like Istio virtual services, Kubernetes deployments and ClusterIP services.
|
||||
> remove all the objects owned by Flagger like Istio virtual services, Kubernetes deployments and ClusterIP services.
|
||||
|
||||
If you want to remove all the objects created by Flagger you have delete the Canary CRD with kubectl:
|
||||
|
||||
@@ -173,13 +154,13 @@ As an alternative to Helm, Flagger can be installed with Kustomize **3.5.0** or
|
||||
Install Flagger for Istio:
|
||||
|
||||
```bash
|
||||
kustomize build https://github.com/weaveworks/flagger/kustomize/istio | kubectl apply -f -
|
||||
kustomize build https://github.com/fluxcd/flagger/kustomize/istio?ref=main | kubectl apply -f -
|
||||
```
|
||||
|
||||
Install Flagger for AWS App Mesh:
|
||||
|
||||
```bash
|
||||
kustomize build https://github.com/weaveworks/flagger/kustomize/appmesh | kubectl apply -f -
|
||||
kustomize build https://github.com/fluxcd/flagger/kustomize/appmesh?ref=main | kubectl apply -f -
|
||||
```
|
||||
|
||||
This deploys Flagger and sets the metrics server URL to App Mesh's Prometheus instance.
|
||||
@@ -187,7 +168,7 @@ This deploys Flagger and sets the metrics server URL to App Mesh's Prometheus in
|
||||
Install Flagger for Linkerd:
|
||||
|
||||
```bash
|
||||
kustomize build https://github.com/weaveworks/flagger/kustomize/linkerd | kubectl apply -f -
|
||||
kustomize build https://github.com/fluxcd/flagger/kustomize/linkerd?ref=main | kubectl apply -f -
|
||||
```
|
||||
|
||||
This deploys Flagger in the `linkerd` namespace and sets the metrics server URL to Linkerd's Prometheus instance.
|
||||
@@ -195,7 +176,7 @@ This deploys Flagger in the `linkerd` namespace and sets the metrics server URL
|
||||
If you want to install a specific Flagger release, add the version number to the URL:
|
||||
|
||||
```bash
|
||||
kustomize build https://github.com/weaveworks/flagger/kustomize/linkerd?ref=v1.0.0 | kubectl apply -f -
|
||||
kustomize build https://github.com/fluxcd/flagger/kustomize/linkerd?ref=v1.0.0 | kubectl apply -f -
|
||||
```
|
||||
|
||||
**Generic installer**
|
||||
@@ -203,11 +184,11 @@ kustomize build https://github.com/weaveworks/flagger/kustomize/linkerd?ref=v1.0
|
||||
Install Flagger and Prometheus for Contour, Gloo, NGINX, Skipper, or Traefik ingress:
|
||||
|
||||
```bash
|
||||
kustomize build https://github.com/weaveworks/flagger/kustomize/kubernetes | kubectl apply -f -
|
||||
kustomize build https://github.com/fluxcd/flagger/kustomize/kubernetes?ref=main | kubectl apply -f -
|
||||
```
|
||||
|
||||
This deploys Flagger and Prometheus in the `flagger-system` namespace, sets the metrics server URL
|
||||
to `http://flagger-prometheus.flagger-system:9090` and the mesh provider to `kubernetes`.
|
||||
This deploys Flagger and Prometheus in the `flagger-system` namespace,
|
||||
sets the metrics server URL to `http://flagger-prometheus.flagger-system:9090` and the mesh provider to `kubernetes`.
|
||||
|
||||
The Prometheus instance has a two hours data retention and is configured to scrape all pods in your cluster
|
||||
that have the `prometheus.io/scrape: "true"` annotation.
|
||||
@@ -234,7 +215,7 @@ Create a kustomization file using Flagger as base and patch the container args:
|
||||
cat > kustomization.yaml <<EOF
|
||||
namespace: istio-system
|
||||
bases:
|
||||
- github.com/weaveworks/flagger/kustomize/base/flagger
|
||||
- https://github.com/fluxcd/flagger/kustomize/kubernetes?ref=main
|
||||
patches:
|
||||
- target:
|
||||
kind: Deployment
|
||||
@@ -252,19 +233,6 @@ patches:
|
||||
args:
|
||||
- -mesh-provider=istio
|
||||
- -metrics-server=http://prometheus.istio-system:9090
|
||||
- -slack-user=flagger
|
||||
- -slack-channel=alerts
|
||||
- -slack-url=https://hooks.slack.com/services/YOUR/SLACK/WEBHOOK
|
||||
- -include-label-prefix=app.kubernetes.io
|
||||
EOF
|
||||
```
|
||||
|
||||
Install Flagger for Istio with Slack notifications:
|
||||
|
||||
```bash
|
||||
kustomize build . | kubectl apply -f -
|
||||
```
|
||||
|
||||
If you want to use MS Teams instead of Slack, replace `-slack-url` with `-msteams-url` and set the webhook address
|
||||
to `https://outlook.office.com/webhook/YOUR/TEAMS/WEBHOOK`.
|
||||
|
||||
|
||||
|
||||
@@ -1,188 +0,0 @@
|
||||
# Flagger Install with SuperGloo
|
||||
|
||||
This guide walks you through setting up Flagger on a Kubernetes cluster using [SuperGloo](https://github.com/solo-io/supergloo).
|
||||
|
||||
SuperGloo by [Solo.io](https://solo.io) is an opinionated abstraction layer that simplifies the installation, management, and operation of your service mesh. It supports running multiple ingresses with multiple meshes \(Istio, App Mesh, Consul Connect and Linkerd 2\) in the same cluster.
|
||||
|
||||
## Prerequisites
|
||||
|
||||
Flagger requires a Kubernetes cluster **v1.11** or newer with the following admission controllers enabled:
|
||||
|
||||
* MutatingAdmissionWebhook
|
||||
* ValidatingAdmissionWebhook
|
||||
|
||||
## Install Istio with SuperGloo
|
||||
|
||||
### Install SuperGloo command line interface helper
|
||||
|
||||
SuperGloo includes a command line helper \(CLI\) that makes operation of SuperGloo easier. The CLI is not required for SuperGloo to function correctly.
|
||||
|
||||
If you use [Homebrew](https://brew.sh) package manager run the following commands to install the SuperGloo CLI.
|
||||
|
||||
```bash
|
||||
brew tap solo-io/tap
|
||||
brew solo-io/tap/supergloo
|
||||
```
|
||||
|
||||
Or you can download SuperGloo CLI and add it to your path:
|
||||
|
||||
```bash
|
||||
curl -sL https://run.solo.io/supergloo/install | sh
|
||||
export PATH=$HOME/.supergloo/bin:$PATH
|
||||
```
|
||||
|
||||
### Install SuperGloo controller
|
||||
|
||||
Deploy the SuperGloo controller in the `supergloo-system` namespace:
|
||||
|
||||
```bash
|
||||
supergloo init
|
||||
```
|
||||
|
||||
This is equivalent to installing SuperGloo using its Helm chart
|
||||
|
||||
```bash
|
||||
helm repo add supergloo http://storage.googleapis.com/supergloo-helm
|
||||
helm upgrade --install supergloo supergloo/supergloo --namespace supergloo-system
|
||||
```
|
||||
|
||||
### Install Istio using SuperGloo
|
||||
|
||||
Create the `istio-system` namespace and install Istio with traffic management, telemetry and Prometheus enabled:
|
||||
|
||||
```bash
|
||||
ISTIO_VER="1.0.6"
|
||||
|
||||
kubectl create namespace istio-system
|
||||
|
||||
supergloo install istio --name istio \
|
||||
--namespace=supergloo-system \
|
||||
--auto-inject=true \
|
||||
--installation-namespace=istio-system \
|
||||
--mtls=false \
|
||||
--prometheus=true \
|
||||
--version=${ISTIO_VER}
|
||||
```
|
||||
|
||||
This creates a Kubernetes Custom Resource \(CRD\) like the following.
|
||||
|
||||
```yaml
|
||||
apiVersion: supergloo.solo.io/v1
|
||||
kind: Install
|
||||
metadata:
|
||||
name: istio
|
||||
namespace: supergloo-system
|
||||
spec:
|
||||
installationNamespace: istio-system
|
||||
mesh:
|
||||
installedMesh:
|
||||
name: istio
|
||||
namespace: supergloo-system
|
||||
istioMesh:
|
||||
enableAutoInject: true
|
||||
enableMtls: false
|
||||
installGrafana: false
|
||||
installJaeger: false
|
||||
installPrometheus: true
|
||||
istioVersion: 1.0.6
|
||||
```
|
||||
|
||||
### Allow Flagger to manipulate SuperGloo
|
||||
|
||||
Create a cluster role binding so that Flagger can manipulate SuperGloo custom resources:
|
||||
|
||||
```bash
|
||||
kubectl create clusterrolebinding flagger-supergloo \
|
||||
--clusterrole=mesh-discovery \
|
||||
--serviceaccount=istio-system:flagger
|
||||
```
|
||||
|
||||
Wait for the Istio control plane to become available:
|
||||
|
||||
```bash
|
||||
kubectl --namespace istio-system rollout status deployment/istio-sidecar-injector
|
||||
kubectl --namespace istio-system rollout status deployment/prometheus
|
||||
```
|
||||
|
||||
## Install Flagger
|
||||
|
||||
Add Flagger Helm repository:
|
||||
|
||||
```bash
|
||||
helm repo add flagger https://flagger.app
|
||||
```
|
||||
|
||||
Install Flagger's Canary CRD:
|
||||
|
||||
```yaml
|
||||
kubectl apply -f https://raw.githubusercontent.com/weaveworks/flagger/master/artifacts/flagger/crd.yaml
|
||||
```
|
||||
|
||||
Deploy Flagger in the _**istio-system**_ namespace and set the service mesh provider to SuperGloo:
|
||||
|
||||
```bash
|
||||
helm upgrade -i flagger flagger/flagger \
|
||||
--namespace=istio-system \
|
||||
--set crd.create=false \
|
||||
--set metricsServer=http://prometheus.istio-system:9090 \
|
||||
--set meshProvider=supergloo:istio.supergloo-system
|
||||
```
|
||||
|
||||
When using SuperGloo the mesh provider format is `supergloo:<MESH-NAME>.<SUPERGLOO-NAMESPACE>`.
|
||||
|
||||
Optionally you can enable **Slack** notifications:
|
||||
|
||||
```bash
|
||||
helm upgrade -i flagger flagger/flagger \
|
||||
--reuse-values \
|
||||
--namespace=istio-system \
|
||||
--set slack.url=https://hooks.slack.com/services/YOUR/SLACK/WEBHOOK \
|
||||
--set slack.channel=general \
|
||||
--set slack.user=flagger
|
||||
```
|
||||
|
||||
## Install Grafana
|
||||
|
||||
Flagger comes with a Grafana dashboard made for monitoring the canary analysis.
|
||||
|
||||
Deploy Grafana in the _**istio-system**_ namespace:
|
||||
|
||||
```bash
|
||||
helm upgrade -i flagger-grafana flagger/grafana \
|
||||
--namespace=istio-system \
|
||||
--set url=http://prometheus.istio-system:9090
|
||||
```
|
||||
|
||||
You can access Grafana using port forwarding:
|
||||
|
||||
```bash
|
||||
kubectl -n istio-system port-forward svc/flagger-grafana 3000:80
|
||||
```
|
||||
|
||||
## Install Load Tester
|
||||
|
||||
Flagger comes with an optional load testing service that generates traffic during canary analysis when configured as a webhook.
|
||||
|
||||
Deploy the load test runner with Helm:
|
||||
|
||||
```bash
|
||||
helm upgrade -i flagger-loadtester flagger/loadtester \
|
||||
--namespace=test \
|
||||
--set cmd.timeout=1h
|
||||
```
|
||||
|
||||
Deploy with kubectl:
|
||||
|
||||
```bash
|
||||
helm fetch --untar --untardir . flagger/loadtester &&
|
||||
helm template loadtester \
|
||||
--name flagger-loadtester \
|
||||
--namespace=test
|
||||
> $HOME/flagger-loadtester.yaml
|
||||
|
||||
# apply
|
||||
kubectl apply -f $HOME/flagger-loadtester.yaml
|
||||
```
|
||||
|
||||
> **Note** that the load tester should be deployed in a namespace with Istio sidecar injection enabled.
|
||||
|
||||
@@ -1,13 +1,14 @@
|
||||
# App Mesh Canary Deployments
|
||||
|
||||
This guide shows you how to use App Mesh and Flagger to automate canary deployments.
|
||||
You'll need an EKS cluster configured with App Mesh,
|
||||
you can find the installion guide [here](https://docs.flagger.app/install/flagger-install-on-eks-appmesh).
|
||||
You'll need an EKS cluster (Kubernetes >= 1.16) configured with App Mesh,
|
||||
you can find the installation guide [here](https://docs.flagger.app/install/flagger-install-on-eks-appmesh).
|
||||
|
||||
## Bootstrap
|
||||
|
||||
Flagger takes a Kubernetes deployment and optionally a horizontal pod autoscaler \(HPA\),
|
||||
then creates a series of objects \(Kubernetes deployments, ClusterIP services, App Mesh virtual nodes and services\).
|
||||
Flagger takes a Kubernetes deployment and optionally a horizontal pod autoscaler (HPA),
|
||||
then creates a series of objects (Kubernetes deployments, ClusterIP services,
|
||||
App Mesh virtual nodes and services).
|
||||
These objects expose the application on the mesh and drive the canary analysis and promotion.
|
||||
The only App Mesh object you need to create by yourself is the mesh resource.
|
||||
|
||||
@@ -42,7 +43,7 @@ EOF
|
||||
Create a deployment and a horizontal pod autoscaler:
|
||||
|
||||
```bash
|
||||
kubectl apply -k github.com/weaveworks/flagger//kustomize/podinfo
|
||||
kubectl apply -k https://github.com/fluxcd/flagger//kustomize/podinfo?ref=main
|
||||
```
|
||||
|
||||
Deploy the load testing service to generate traffic during the canary analysis:
|
||||
@@ -167,13 +168,13 @@ virtualservice.appmesh.k8s.aws/podinfo
|
||||
virtualservice.appmesh.k8s.aws/podinfo-canary
|
||||
```
|
||||
|
||||
After the boostrap, the podinfo deployment will be scaled to zero and the traffic to
|
||||
`podinfo.test` will be routed to the primary pods.
|
||||
After the boostrap, the podinfo deployment will be scaled to zero and the traffic to `podinfo.test`
|
||||
will be routed to the primary pods.
|
||||
During the canary analysis, the `podinfo-canary.test` address can be used to target directly the canary pods.
|
||||
|
||||
App Mesh blocks all egress traffic by default.
|
||||
If your application needs to call another service, you have to
|
||||
create an App Mesh virtual service for it and add the virtual service name to the backend list.
|
||||
If your application needs to call another service, you have to create an App Mesh virtual service for it
|
||||
and add the virtual service name to the backend list.
|
||||
|
||||
```yaml
|
||||
service:
|
||||
@@ -234,7 +235,7 @@ Open your browser and navigate to the ingress address to access podinfo UI.
|
||||
|
||||
A canary deployment is triggered by changes in any of the following objects:
|
||||
|
||||
* Deployment PodSpec \(container image, command, ports, env, resources, etc\)
|
||||
* Deployment PodSpec (container image, command, ports, env, resources, etc)
|
||||
* ConfigMaps and Secrets mounted as volumes or mapped to environment variables
|
||||
|
||||
Trigger a canary deployment by updating the container image:
|
||||
@@ -281,7 +282,7 @@ During the analysis the canary’s progress can be monitored with Grafana.
|
||||
The App Mesh dashboard URL is
|
||||
[http://localhost:3000/d/flagger-appmesh/appmesh-canary?refresh=10s&orgId=1&var-namespace=test&var-primary=podinfo-primary&var-canary=podinfo](http://localhost:3000/d/flagger-appmesh/appmesh-canary?refresh=10s&orgId=1&var-namespace=test&var-primary=podinfo-primary&var-canary=podinfo).
|
||||
|
||||

|
||||
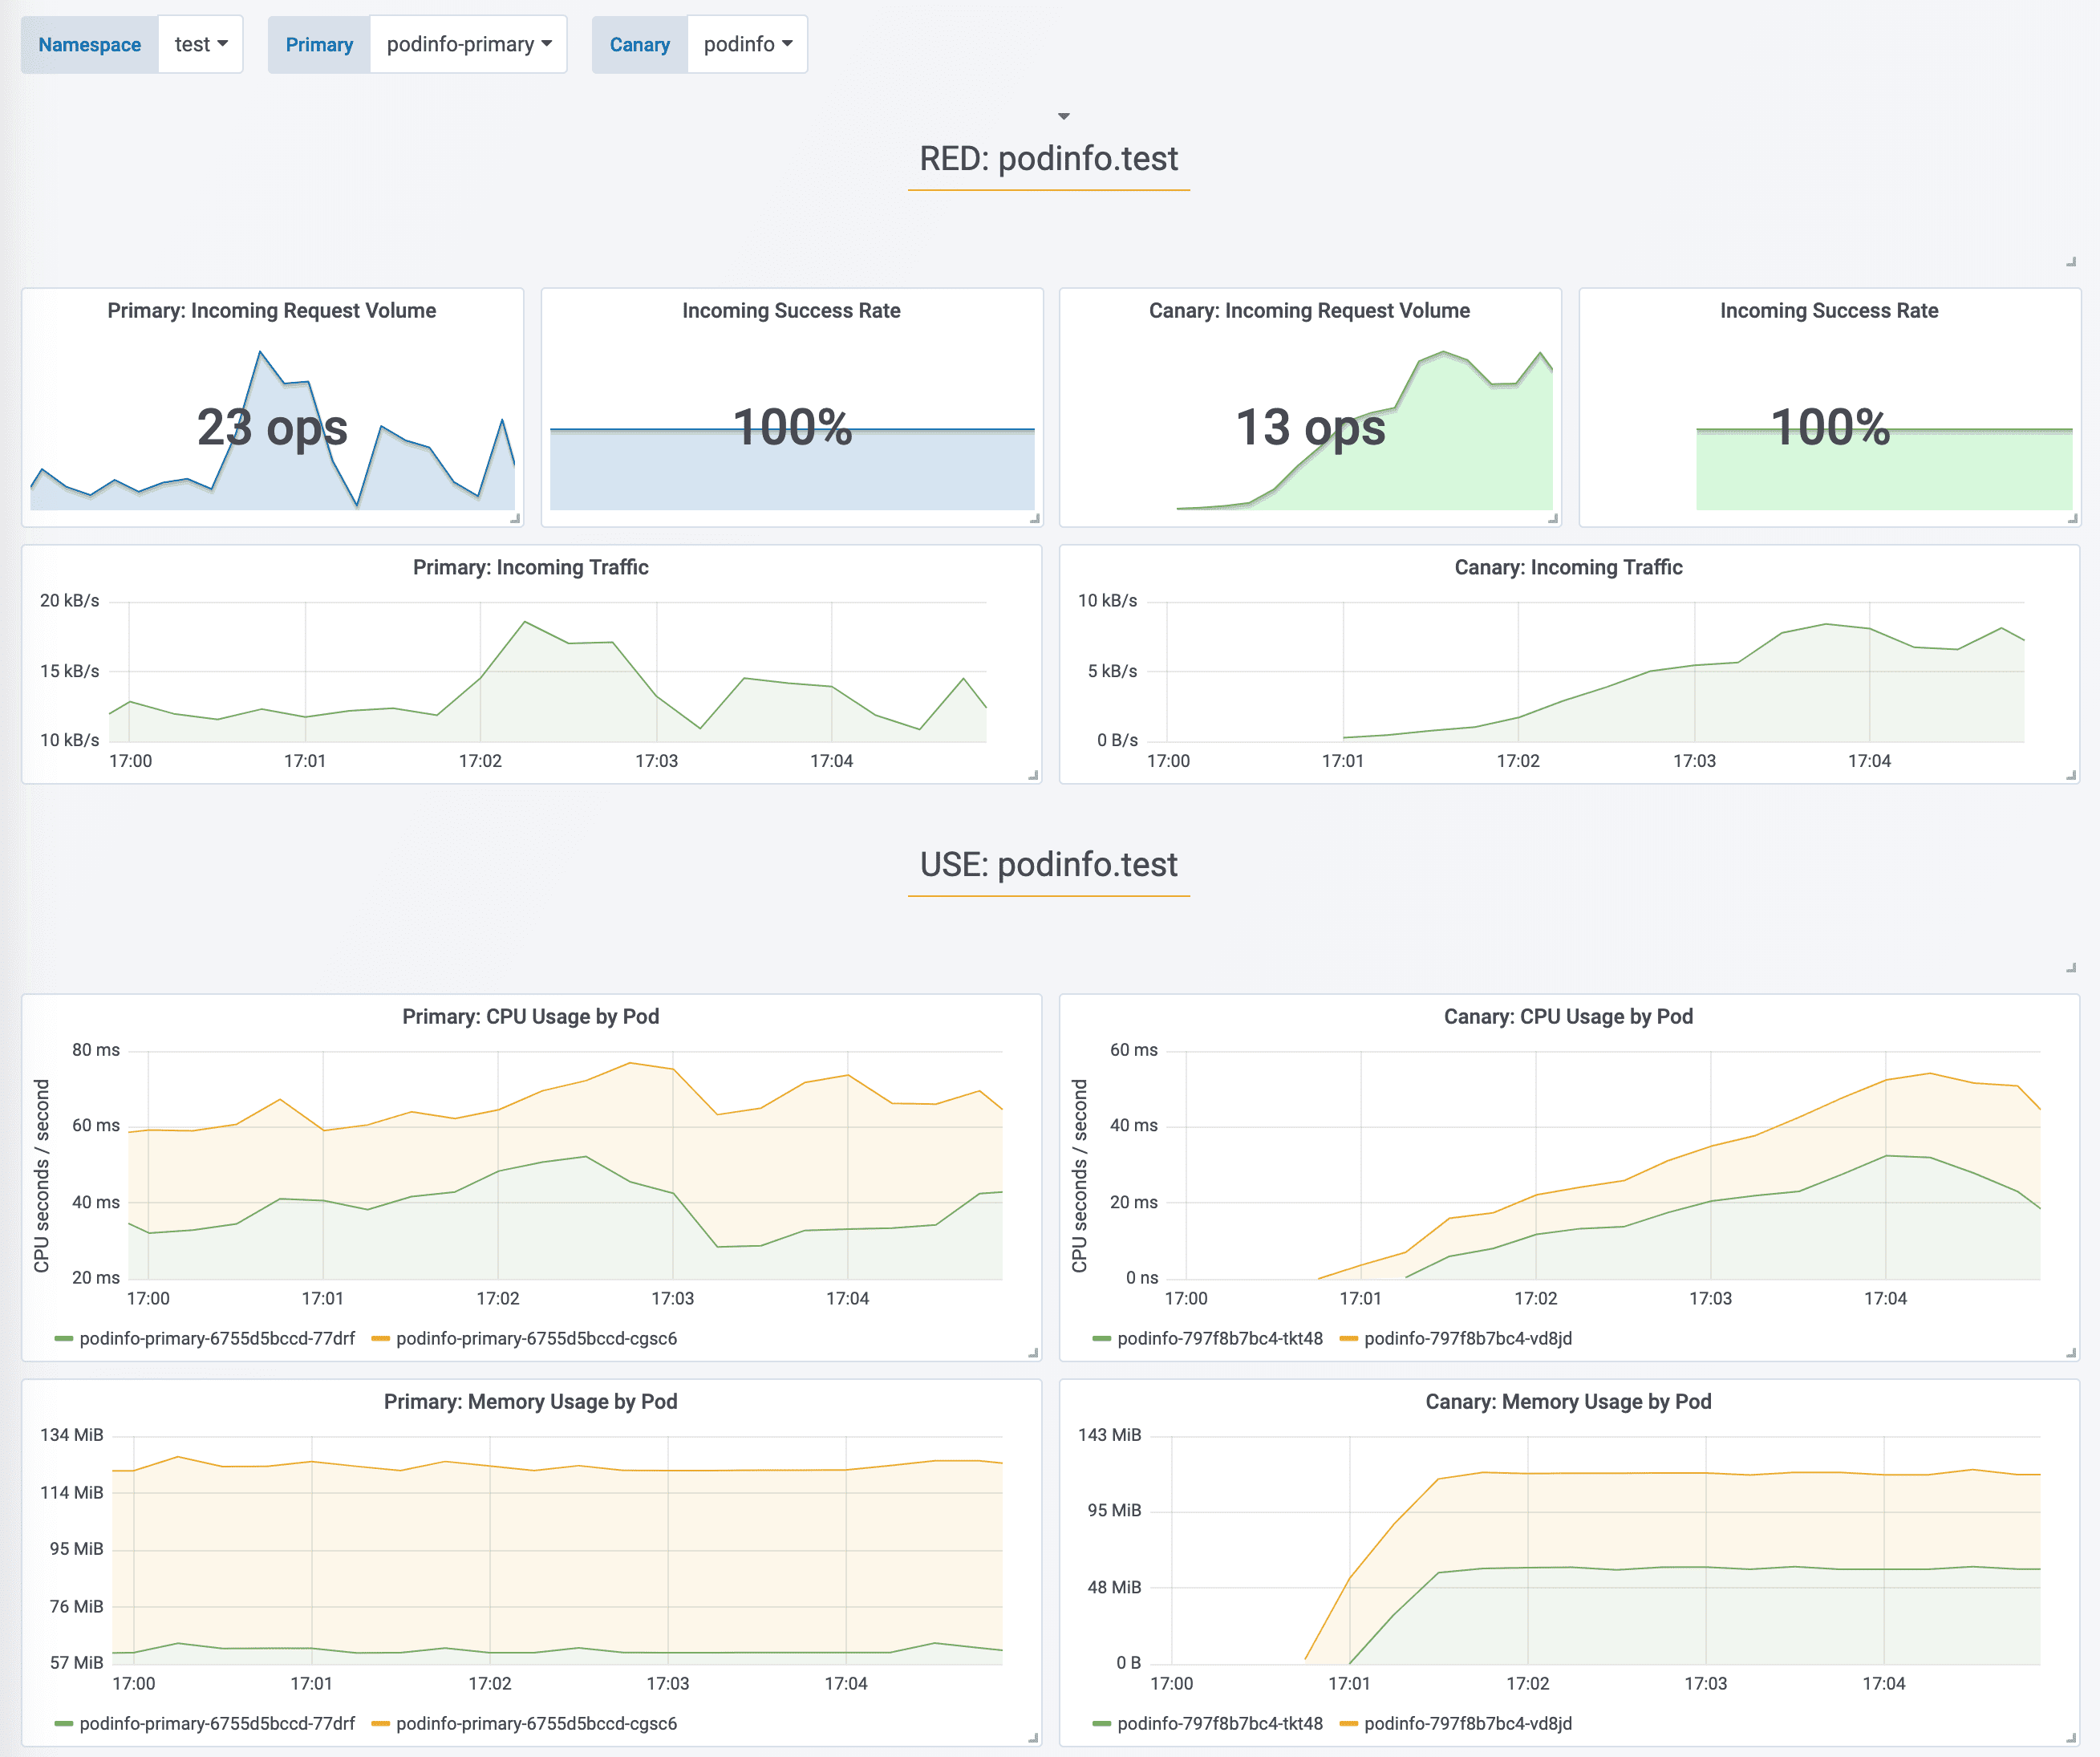
|
||||
|
||||
You can monitor all canaries with:
|
||||
|
||||
@@ -296,7 +297,7 @@ prod backend Failed 0
|
||||
|
||||
If you’ve enabled the Slack notifications, you should receive the following messages:
|
||||
|
||||
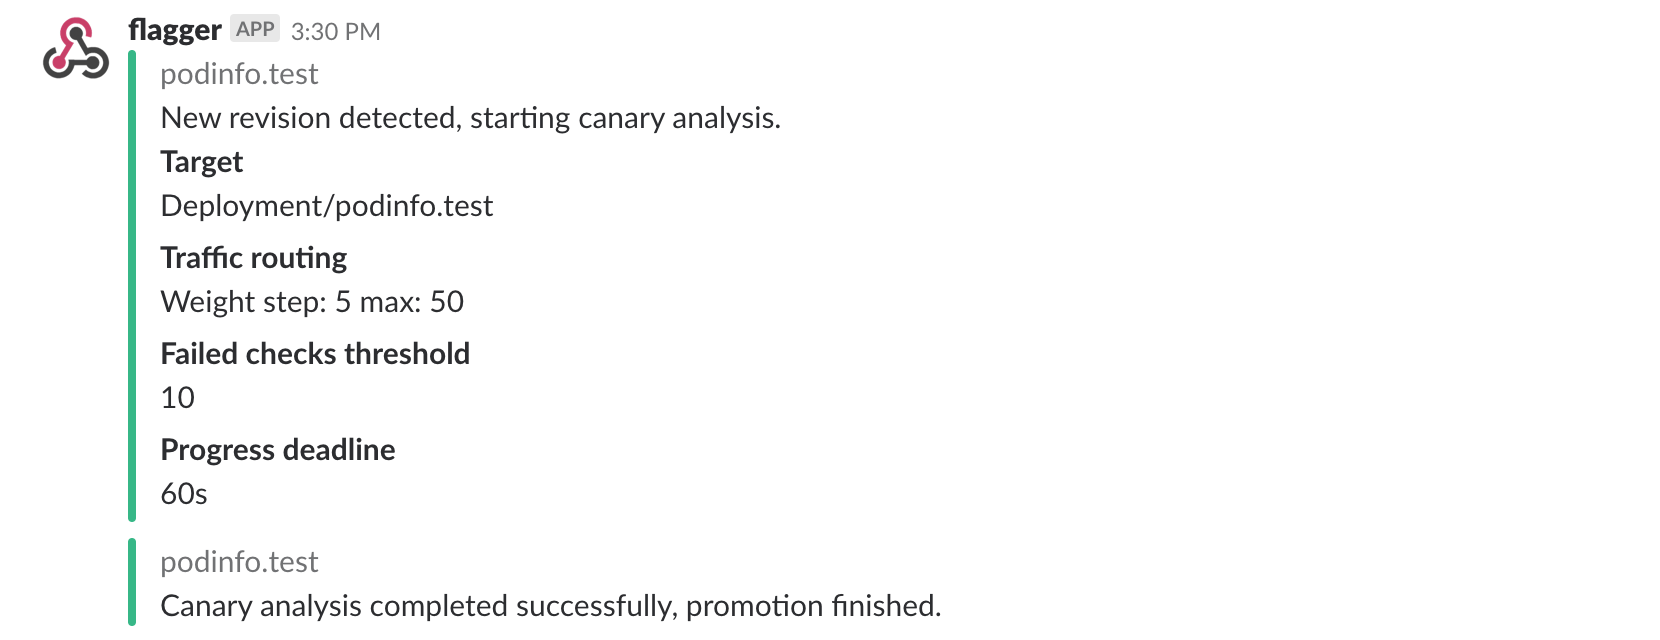
|
||||

|
||||
|
||||
## Automated rollback
|
||||
|
||||
@@ -350,7 +351,7 @@ Canary failed! Scaling down podinfo.test
|
||||
If you’ve enabled the Slack notifications, you’ll receive a message if the progress deadline is exceeded,
|
||||
or if the analysis reached the maximum number of failed checks:
|
||||
|
||||

|
||||
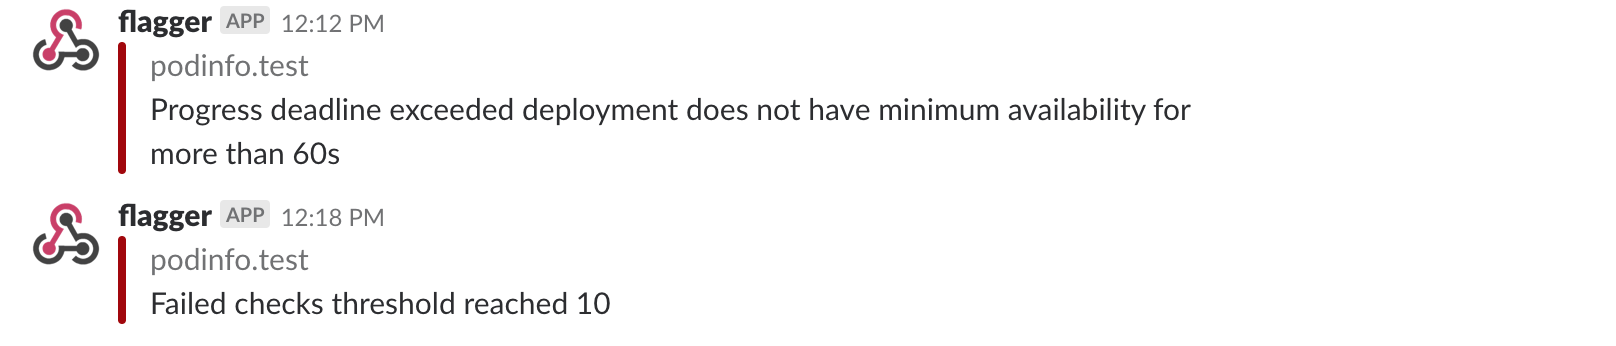
|
||||
|
||||
## A/B Testing
|
||||
|
||||
@@ -358,7 +359,7 @@ Besides weighted routing, Flagger can be configured to route traffic to the cana
|
||||
In an A/B testing scenario, you'll be using HTTP headers or cookies to target a certain segment of your users.
|
||||
This is particularly useful for frontend applications that require session affinity.
|
||||
|
||||

|
||||
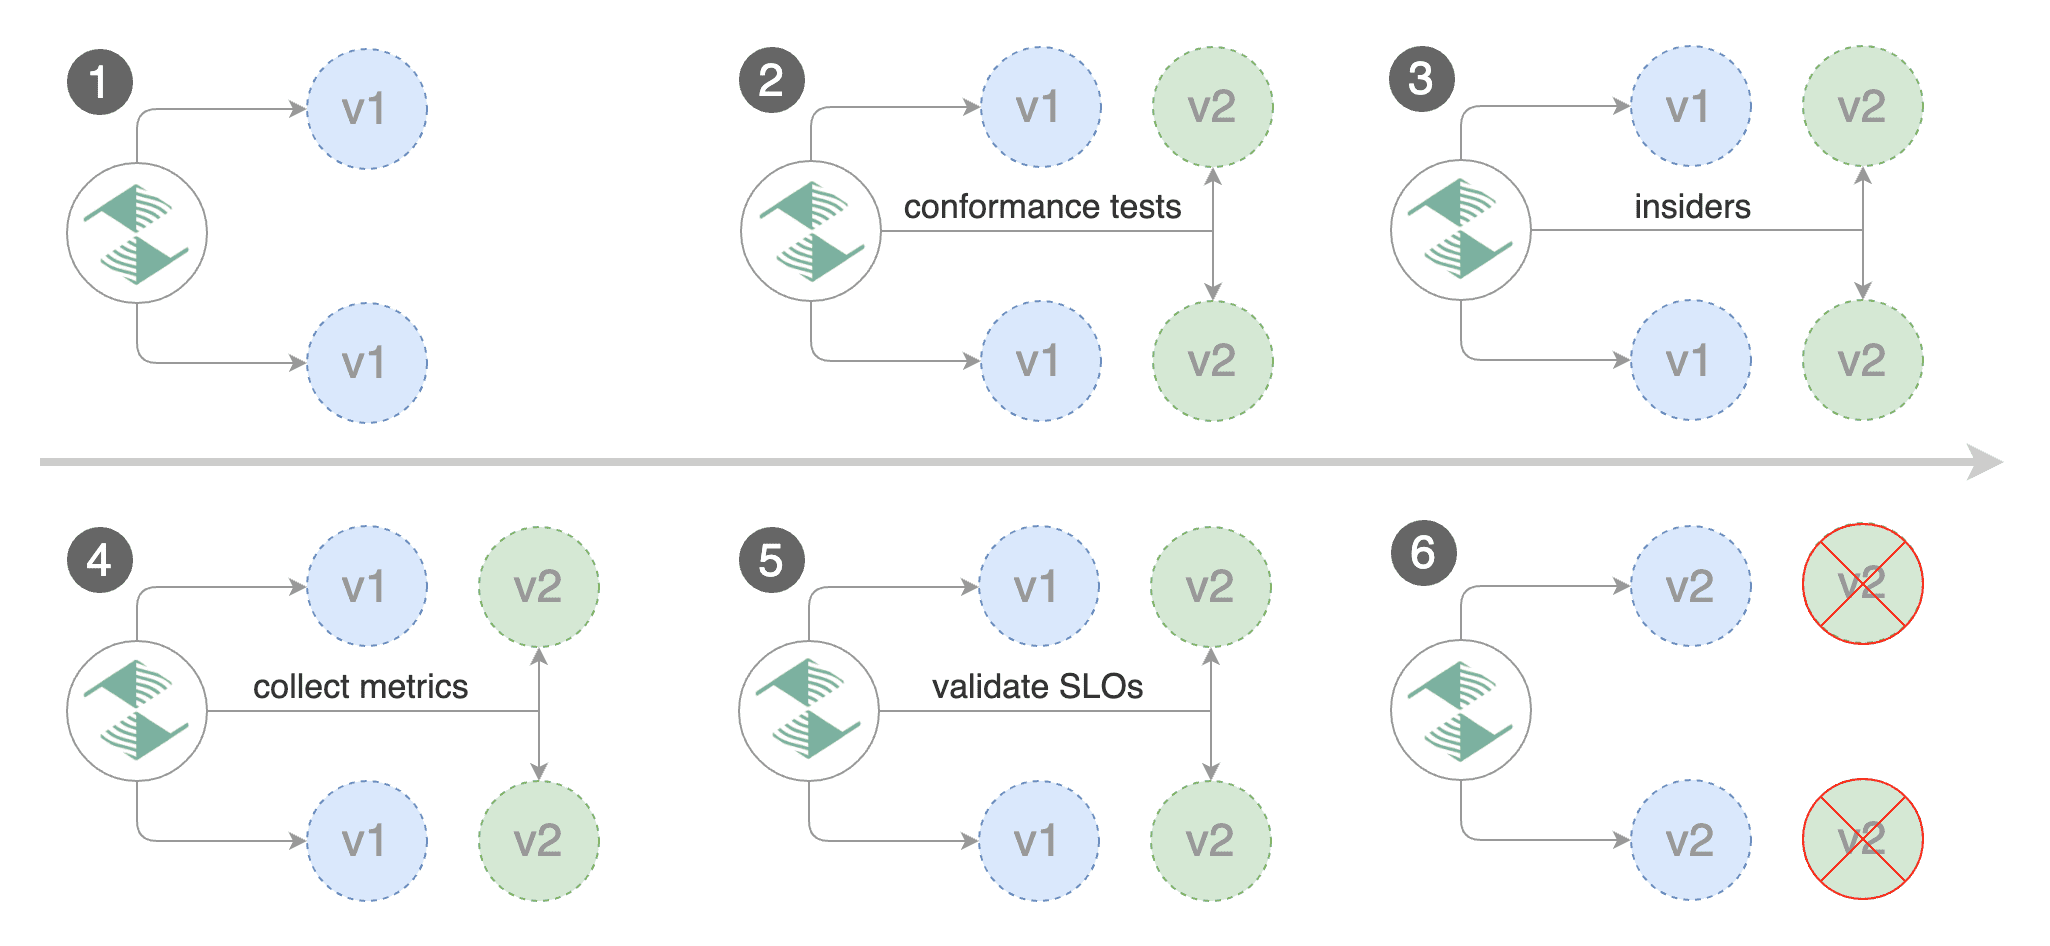
|
||||
|
||||
Edit the canary analysis, remove the max/step weight and add the match conditions and iterations:
|
||||
|
||||
@@ -423,4 +424,8 @@ Routing all traffic to primary
|
||||
Promotion completed! Scaling down podinfo.test
|
||||
```
|
||||
|
||||
For an in-depth look at the analysis process read the [usage docs](../usage/how-it-works.md).
|
||||
The above procedure can be extended with
|
||||
[custom metrics](../usage/metrics.md) checks,
|
||||
[webhooks](../usage/webhooks.md),
|
||||
[manual promotion](../usage/webhooks.md#manual-gating) approval and
|
||||
[Slack or MS Teams](../usage/alerting.md) notifications.
|
||||
|
||||
@@ -30,7 +30,7 @@ You can find the chart source [here](https://github.com/stefanprodan/flagger/tre
|
||||
Create a test namespace with Istio sidecar injection enabled:
|
||||
|
||||
```bash
|
||||
export REPO=https://raw.githubusercontent.com/weaveworks/flagger/master
|
||||
export REPO=https://raw.githubusercontent.com/fluxcd/flagger/main
|
||||
|
||||
kubectl apply -f ${REPO}/artifacts/namespaces/test.yaml
|
||||
```
|
||||
@@ -77,7 +77,7 @@ When the `frontend-primary` deployment comes online, Flagger will route all traf
|
||||
|
||||
Open your browser and navigate to the frontend URL:
|
||||
|
||||

|
||||
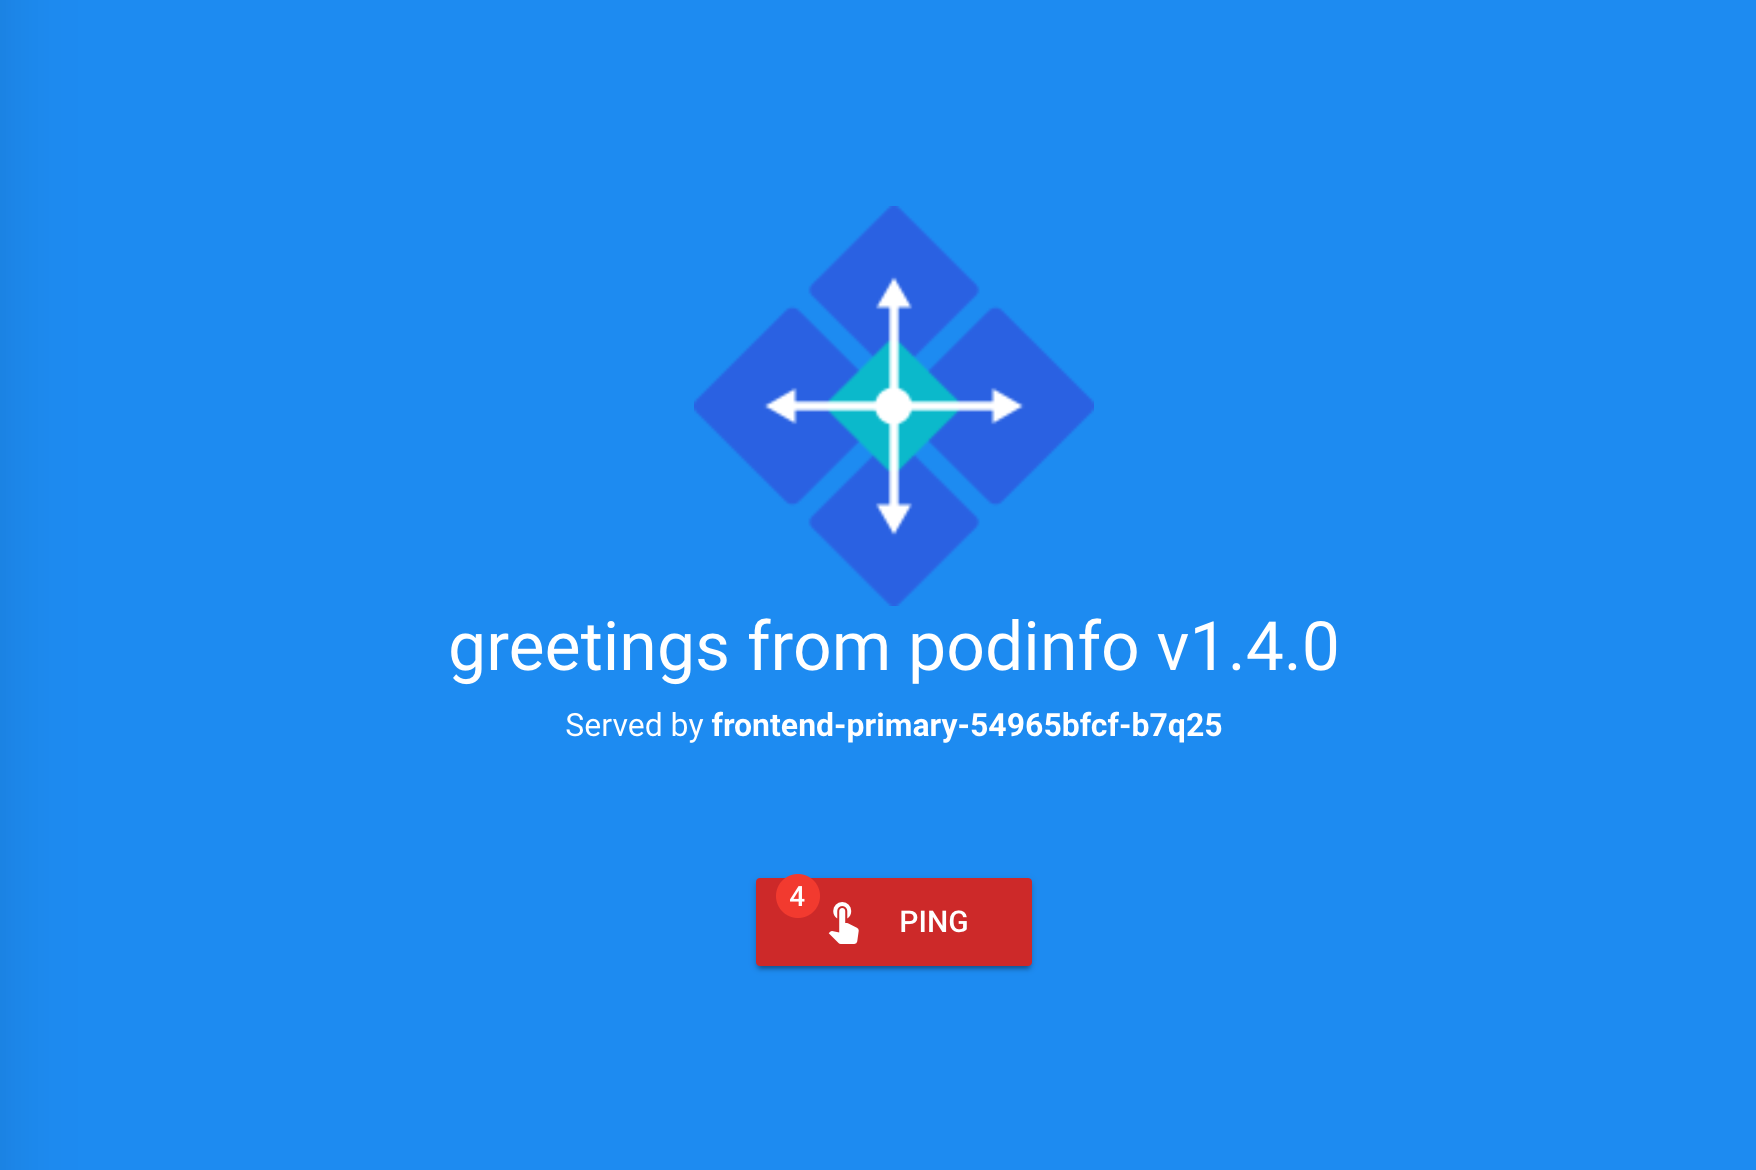
|
||||
|
||||
Now let's install the `backend` release without exposing it outside the mesh:
|
||||
|
||||
@@ -101,7 +101,7 @@ frontend Initialized 0 2019-02-12T17:50:50Z
|
||||
|
||||
Click on the ping button in the `frontend` UI to trigger a HTTP POST request that will reach the `backend` app:
|
||||
|
||||

|
||||
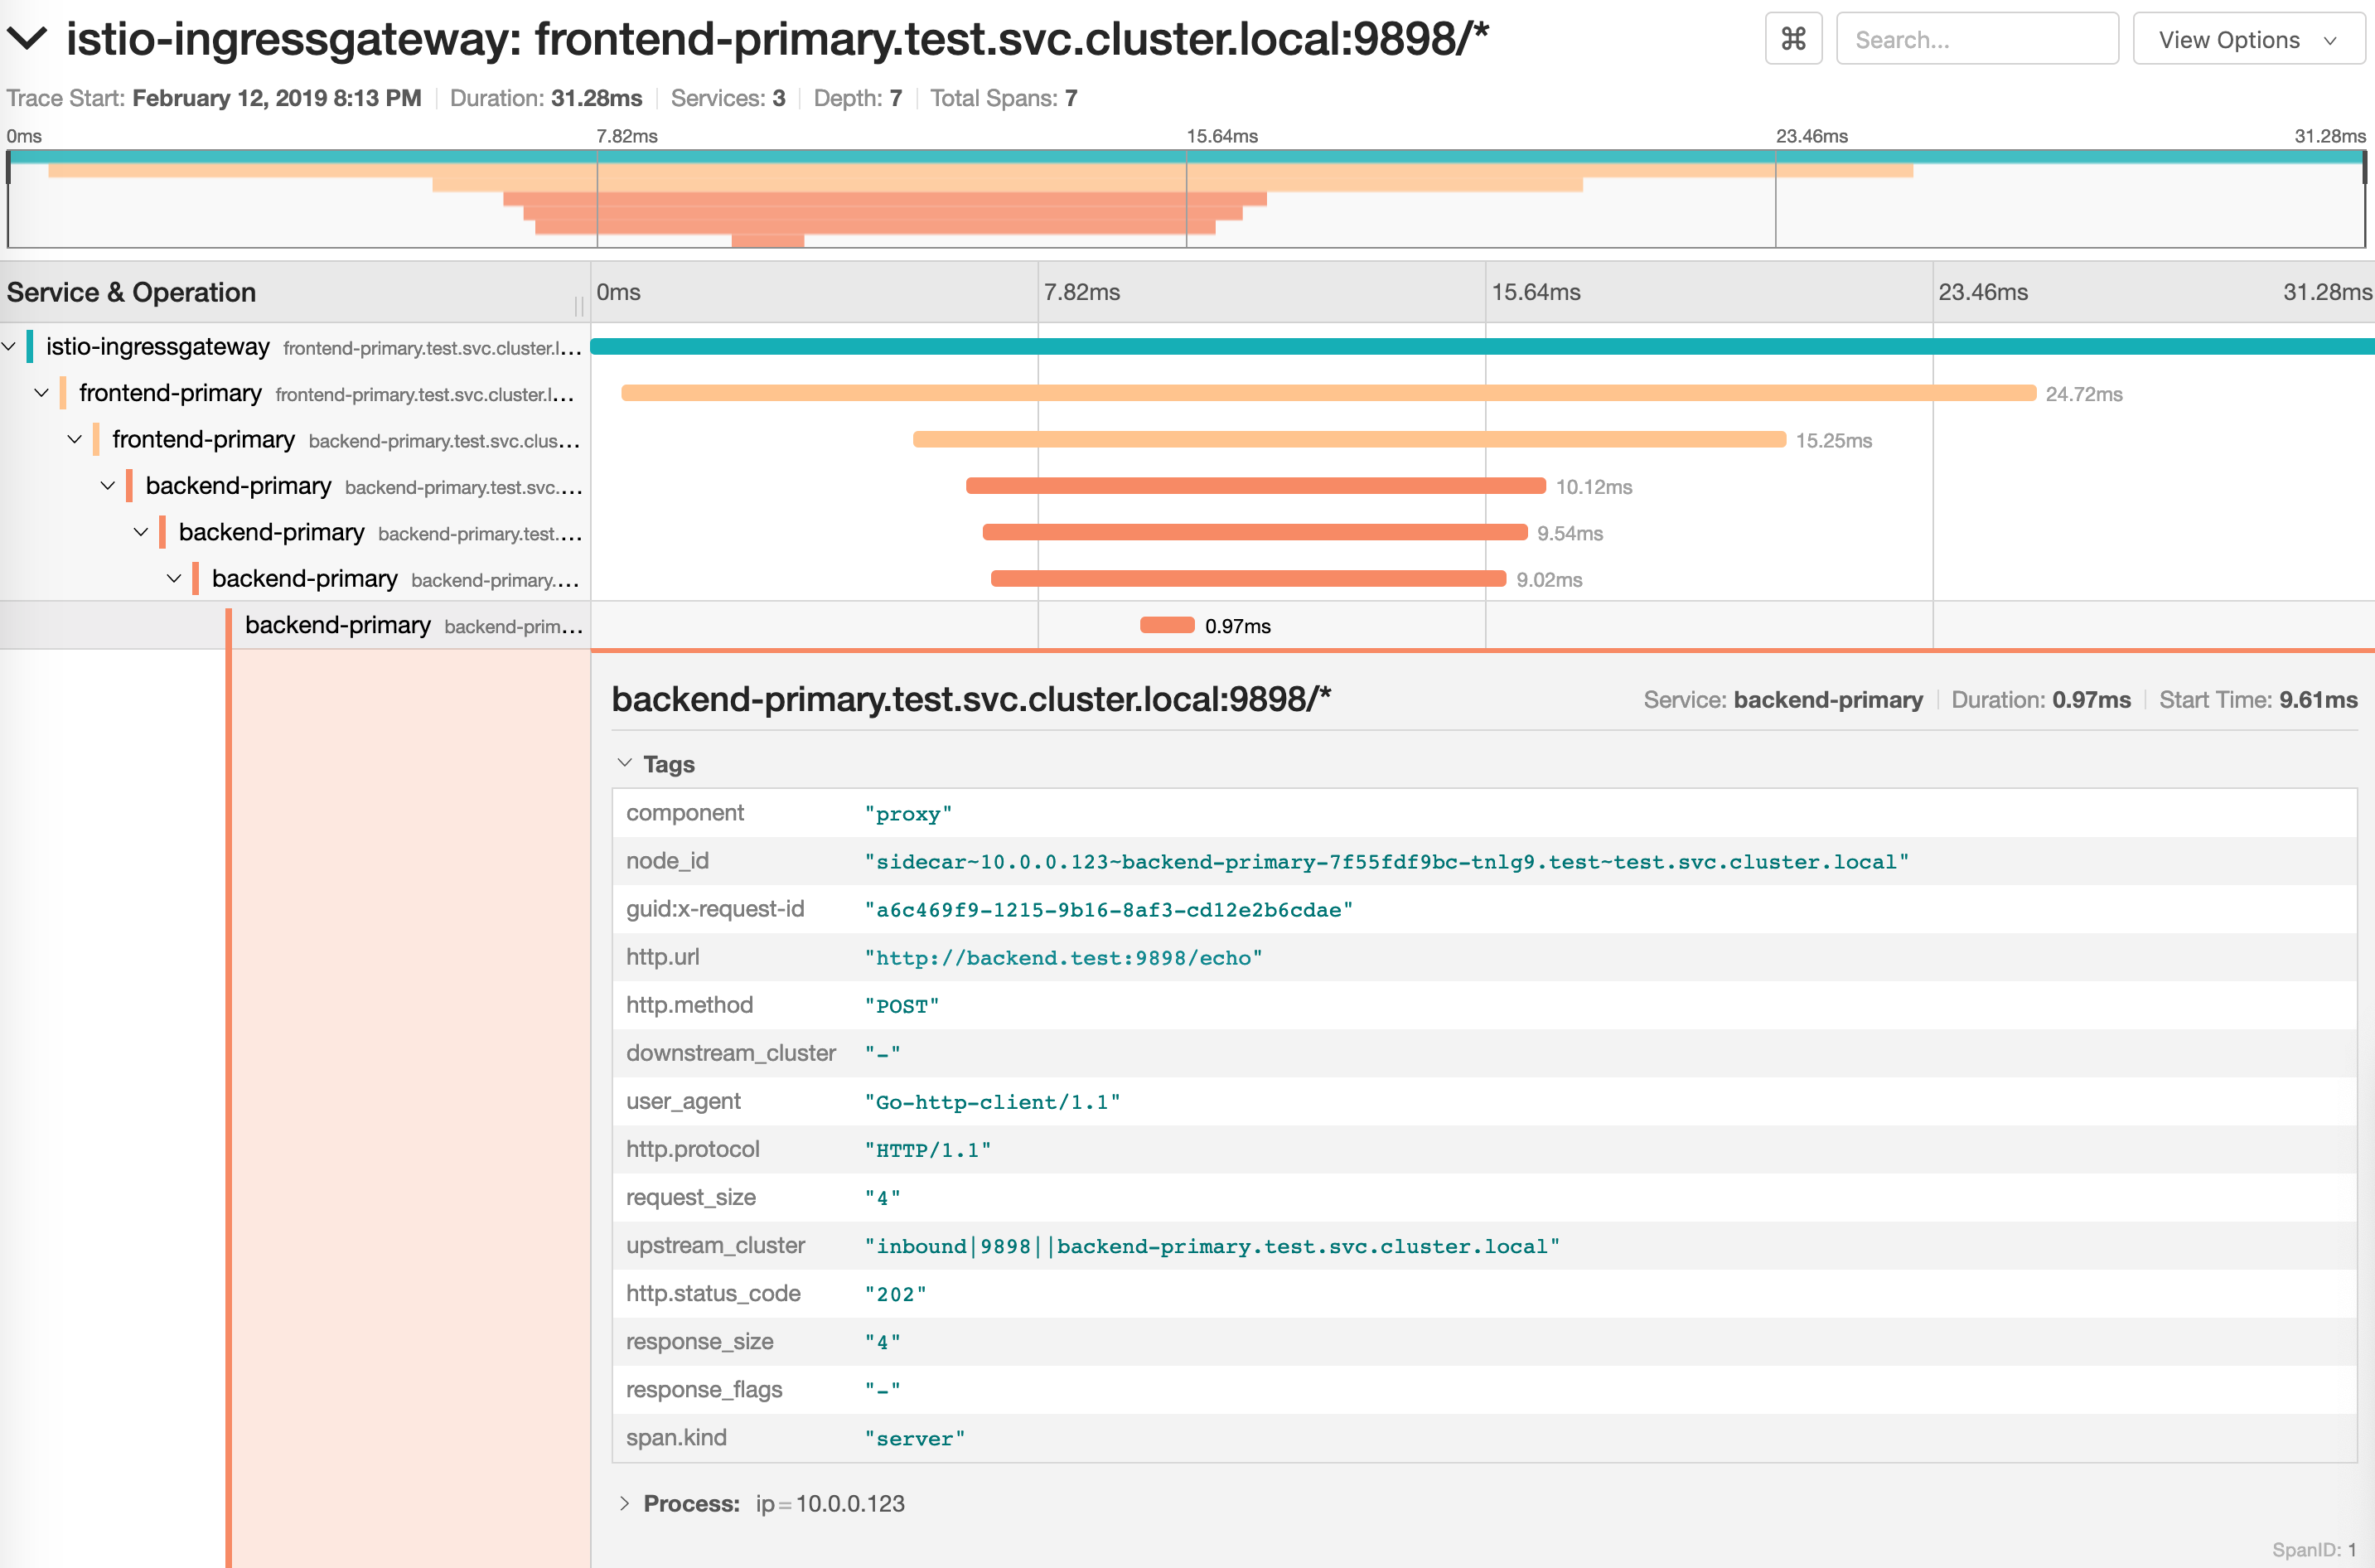
|
||||
|
||||
We'll use the `/echo` endpoint \(same as the one the ping button calls\) to generate load on both apps during a canary deployment.
|
||||
|
||||
@@ -159,7 +159,7 @@ Promotion completed! Scaling down frontend.test
|
||||
|
||||
You can monitor the canary deployment with Grafana. Open the Flagger dashboard, select `test` from the namespace dropdown, `frontend-primary` from the primary dropdown and `frontend` from the canary dropdown.
|
||||
|
||||
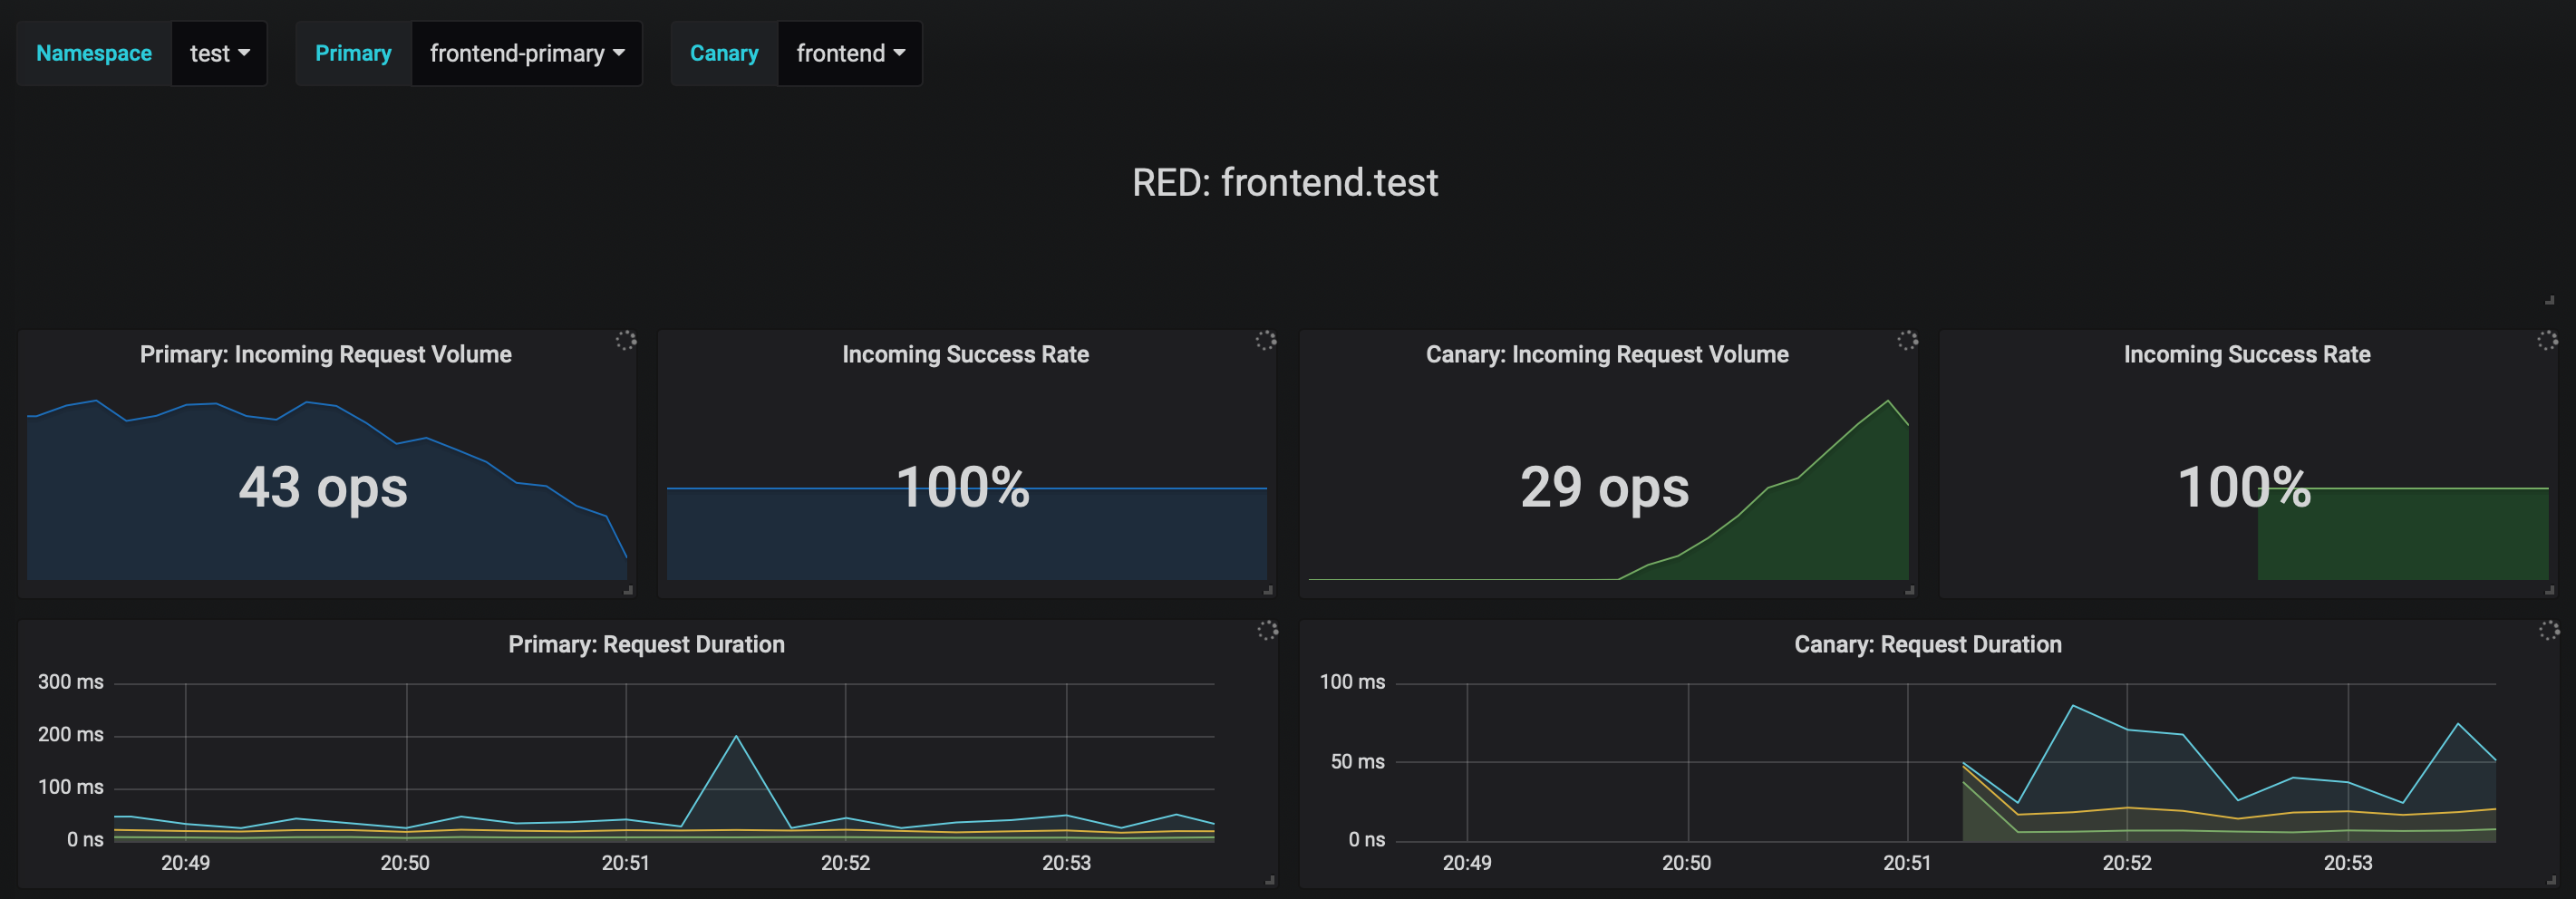
|
||||

|
||||
|
||||
Now trigger a canary deployment for the `backend` app, but this time you'll change a value in the configmap:
|
||||
|
||||
@@ -217,7 +217,7 @@ Copying backend.test template spec to backend-primary.test
|
||||
Promotion completed! Scaling down backend.test
|
||||
```
|
||||
|
||||

|
||||
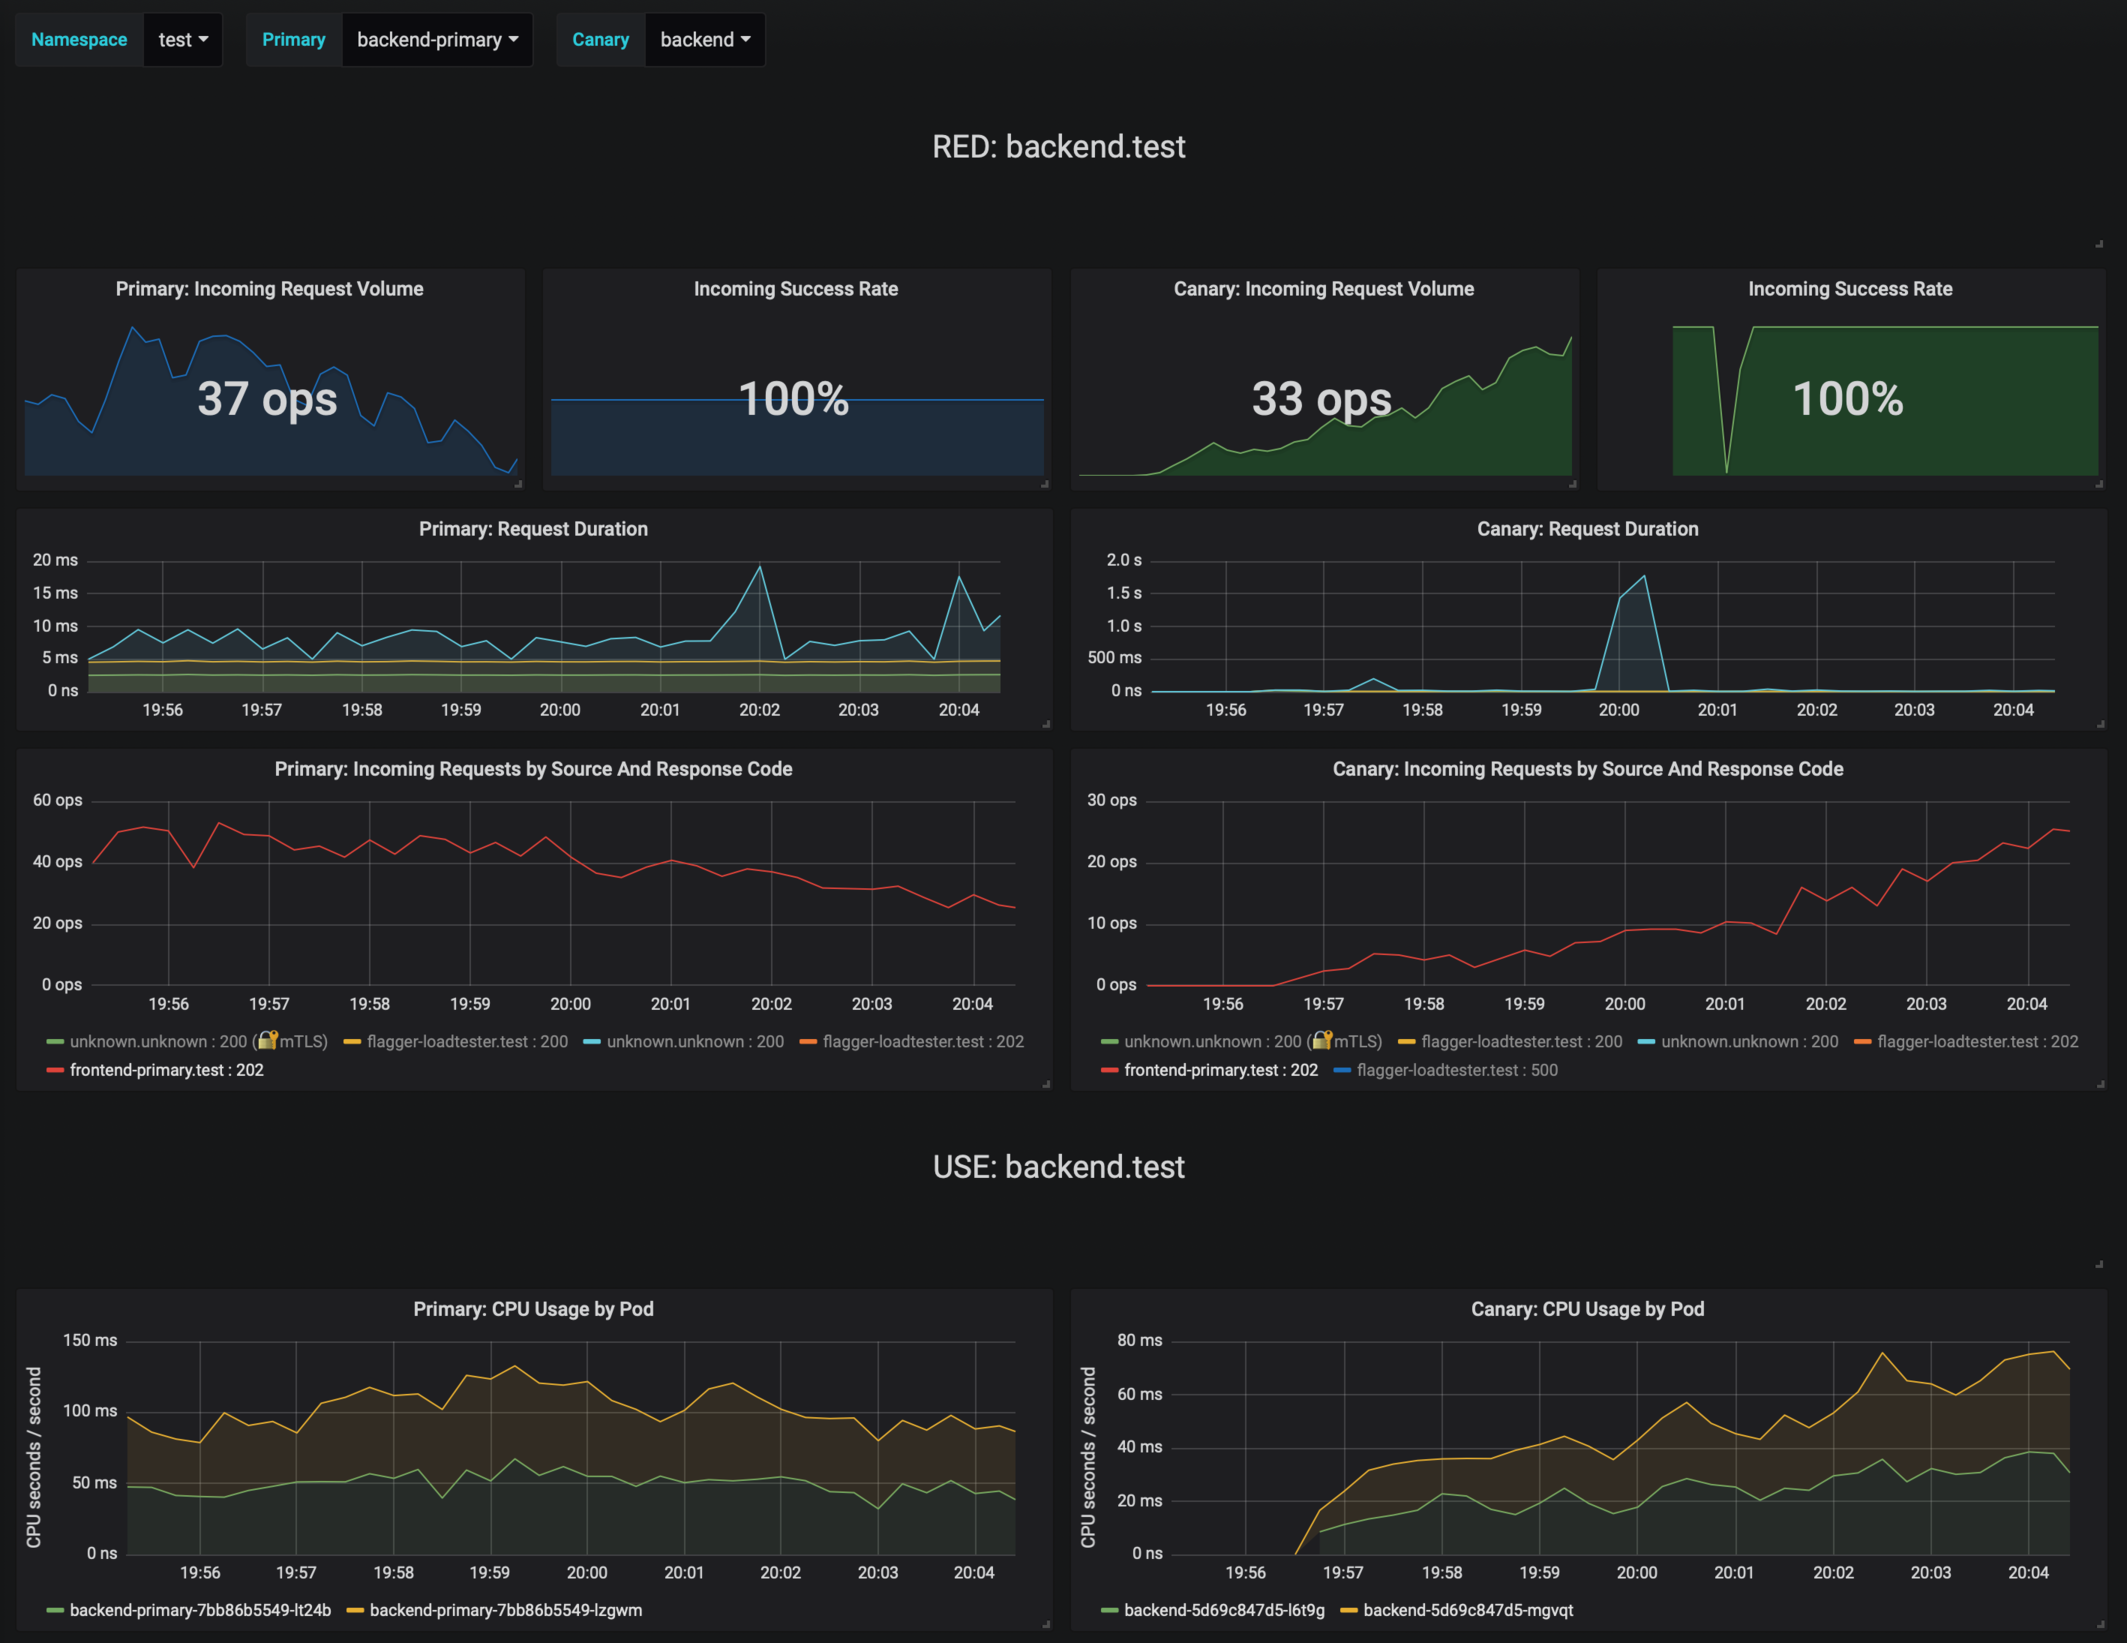
|
||||
|
||||
If the number of failed checks reaches the canary analysis threshold, the traffic is routed back to the primary, the canary is scaled to zero and the rollout is marked as failed.
|
||||
|
||||
@@ -235,7 +235,7 @@ If you've enabled the Slack notifications, you'll receive an alert with the reas
|
||||
|
||||
Instead of using Helm CLI from a CI tool to perform the install and upgrade, you could use a Git based approach. GitOps is a way to do Continuous Delivery, it works by using Git as a source of truth for declarative infrastructure and workloads. In the [GitOps model](https://www.weave.works/technologies/gitops/), any change to production must be committed in source control prior to being applied on the cluster. This way rollback and audit logs are provided by Git.
|
||||
|
||||
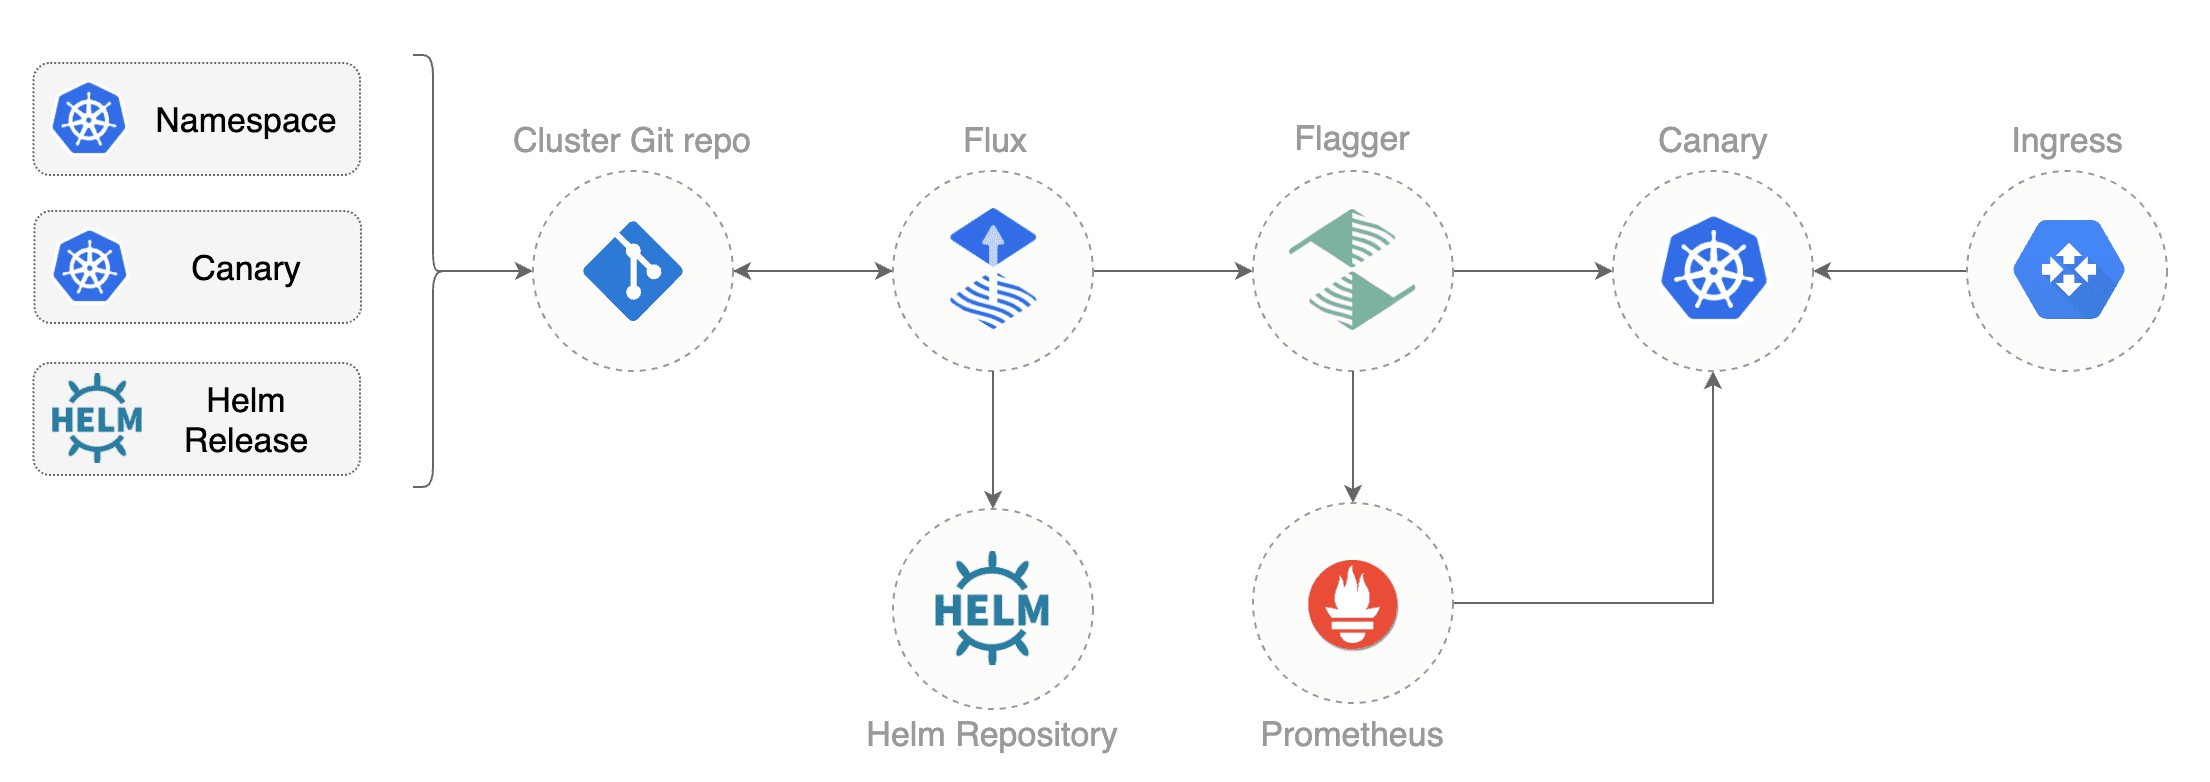
|
||||

|
||||
|
||||
In order to apply the GitOps pipeline model to Flagger canary deployments you'll need a Git repository with your workloads definitions in YAML format, a container registry where your CI system pushes immutable images and an operator that synchronizes the Git repo with the cluster state.
|
||||
|
||||
@@ -286,15 +286,11 @@ spec:
|
||||
enabled: true
|
||||
```
|
||||
|
||||
In the `chart` section I've defined the release source by specifying the Helm repository (hosted on GitHub Pages),
|
||||
chart name and version. In the `values` section I've overwritten the defaults set in values.yaml.
|
||||
In the `chart` section I've defined the release source by specifying the Helm repository \(hosted on GitHub Pages\), chart name and version. In the `values` section I've overwritten the defaults set in values.yaml.
|
||||
|
||||
With the `fluxcd.io` annotations I instruct Flux to automate this release.
|
||||
When an image tag in the sem ver range of `3.1.0 - 3.1.99` is pushed to Docker Hub,
|
||||
Flux will upgrade the Helm release and from there Flagger will pick up the change and start a canary deployment.
|
||||
With the `fluxcd.io` annotations I instruct Flux to automate this release. When an image tag in the sem ver range of `3.1.0 - 3.1.99` is pushed to Docker Hub, Flux will upgrade the Helm release and from there Flagger will pick up the change and start a canary deployment.
|
||||
|
||||
Install [Flux](https://github.com/fluxcd/flux) and its
|
||||
[Helm Operator](https://github.com/fluxcd/helm-operator) by specifying your Git repo URL:
|
||||
Install [Flux](https://github.com/fluxcd/flux) and its [Helm Operator](https://github.com/fluxcd/helm-operator) by specifying your Git repo URL:
|
||||
|
||||
```bash
|
||||
helm repo add fluxcd https://charts.fluxcd.io
|
||||
@@ -315,14 +311,11 @@ At startup Flux generates a SSH key and logs the public key. Find the SSH public
|
||||
kubectl -n fluxcd logs deployment/flux | grep identity.pub | cut -d '"' -f2
|
||||
```
|
||||
|
||||
In order to sync your cluster state with Git you need to copy the public key
|
||||
and create a deploy key with write access on your GitHub repository.
|
||||
In order to sync your cluster state with Git you need to copy the public key and create a deploy key with write access on your GitHub repository.
|
||||
|
||||
Open GitHub, navigate to your fork, go to _Setting > Deploy keys_ click on _Add deploy key_, check _Allow write access_,
|
||||
paste the Flux public key and click _Add key_.
|
||||
Open GitHub, navigate to your fork, go to _Setting > Deploy keys_ click on _Add deploy key_, check _Allow write access_, paste the Flux public key and click _Add key_.
|
||||
|
||||
After a couple of seconds Flux will apply the Kubernetes resources from Git and
|
||||
Flagger will launch the `frontend` and `backend` apps.
|
||||
After a couple of seconds Flux will apply the Kubernetes resources from Git and Flagger will launch the `frontend` and `backend` apps.
|
||||
|
||||
A CI/CD pipeline for the `frontend` release could look like this:
|
||||
|
||||
@@ -343,14 +336,12 @@ If the canary fails, fix the bug, do another patch release eg `3.1.2` and the wh
|
||||
A canary deployment can fail due to any of the following reasons:
|
||||
|
||||
* the container image can't be downloaded
|
||||
* the deployment replica set is stuck for more then ten minutes (eg. due to a container crash loop)
|
||||
* the webooks (acceptance tests, helm tests, load tests, etc) are returning a non 2xx response
|
||||
* the HTTP success rate (non 5xx responses) metric drops under the threshold
|
||||
* the deployment replica set is stuck for more then ten minutes \(eg. due to a container crash loop\)
|
||||
* the webooks \(acceptance tests, helm tests, load tests, etc\) are returning a non 2xx response
|
||||
* the HTTP success rate \(non 5xx responses\) metric drops under the threshold
|
||||
* the HTTP average duration metric goes over the threshold
|
||||
* the Istio telemetry service is unable to collect traffic metrics
|
||||
* the metrics server (Prometheus) can't be reached
|
||||
* the metrics server \(Prometheus\) can't be reached
|
||||
|
||||
If you want to find out more about managing Helm releases with Flux here are two in-depth guides:
|
||||
[gitops-helm](https://github.com/stefanprodan/gitops-helm)
|
||||
and [gitops-istio](https://github.com/stefanprodan/gitops-istio).
|
||||
If you want to find out more about managing Helm releases with Flux here are two in-depth guides: [gitops-helm](https://github.com/stefanprodan/gitops-helm) and [gitops-istio](https://github.com/stefanprodan/gitops-istio).
|
||||
|
||||
|
||||
@@ -2,11 +2,11 @@
|
||||
|
||||
This guide shows you how to use [Contour](https://projectcontour.io/) ingress controller and Flagger to automate canary releases and A/B testing.
|
||||
|
||||

|
||||

|
||||
|
||||
## Prerequisites
|
||||
|
||||
Flagger requires a Kubernetes cluster **v1.11** or newer and Contour **v1.0** or newer.
|
||||
Flagger requires a Kubernetes cluster **v1.16** or newer and Contour **v1.0** or newer.
|
||||
|
||||
Install Contour on a cluster with LoadBalancer support:
|
||||
|
||||
@@ -19,7 +19,7 @@ The above command will deploy Contour and an Envoy daemonset in the `projectcont
|
||||
Install Flagger using Kustomize (kubectl 1.14) in the `projectcontour` namespace:
|
||||
|
||||
```bash
|
||||
kubectl apply -k github.com/weaveworks/flagger//kustomize/contour
|
||||
kubectl apply -k https://github.com/fluxcd/flagger//kustomize/contour?ref=main
|
||||
```
|
||||
|
||||
The above command will deploy Flagger and Prometheus configured to scrape the Contour's Envoy instances.
|
||||
@@ -36,14 +36,11 @@ helm upgrade -i flagger flagger/flagger \
|
||||
--set prometheus.install=true
|
||||
```
|
||||
|
||||
You can also enable Slack, Discord, Rocket or MS Teams notifications,
|
||||
see the alerting [docs](../usage/alerting.md).
|
||||
You can also enable Slack, Discord, Rocket or MS Teams notifications, see the alerting [docs](../usage/alerting.md).
|
||||
|
||||
## Bootstrap
|
||||
|
||||
Flagger takes a Kubernetes deployment and optionally a horizontal pod autoscaler (HPA),
|
||||
then creates a series of objects (Kubernetes deployments, ClusterIP services and Contour HTTPProxy).
|
||||
These objects expose the application in the cluster and drive the canary analysis and promotion.
|
||||
Flagger takes a Kubernetes deployment and optionally a horizontal pod autoscaler \(HPA\), then creates a series of objects \(Kubernetes deployments, ClusterIP services and Contour HTTPProxy\). These objects expose the application in the cluster and drive the canary analysis and promotion.
|
||||
|
||||
Create a test namespace:
|
||||
|
||||
@@ -54,16 +51,16 @@ kubectl create ns test
|
||||
Install the load testing service to generate traffic during the canary analysis:
|
||||
|
||||
```bash
|
||||
kubectl apply -k github.com/weaveworks/flagger//kustomize/tester
|
||||
kubectl apply -k https://github.com/fluxcd/flagger//kustomize/tester?ref=main
|
||||
```
|
||||
|
||||
Create a deployment and a horizontal pod autoscaler:
|
||||
|
||||
```bash
|
||||
kubectl apply -k github.com/weaveworks/flagger//kustomize/podinfo
|
||||
kubectl apply -k https://github.com/fluxcd/flagger//kustomize/podinfo?ref=main
|
||||
```
|
||||
|
||||
Create a canary custom resource (replace `app.example.com` with your own domain):
|
||||
Create a canary custom resource \(replace `app.example.com` with your own domain\):
|
||||
|
||||
```yaml
|
||||
apiVersion: flagger.app/v1beta1
|
||||
@@ -160,9 +157,7 @@ service/podinfo-primary
|
||||
httpproxy.projectcontour.io/podinfo
|
||||
```
|
||||
|
||||
After the boostrap, the podinfo deployment will be scaled to zero and the traffic to `podinfo.test`
|
||||
will be routed to the primary pods.
|
||||
During the canary analysis, the `podinfo-canary.test` address can be used to target directly the canary pods.
|
||||
After the boostrap, the podinfo deployment will be scaled to zero and the traffic to `podinfo.test` will be routed to the primary pods. During the canary analysis, the `podinfo-canary.test` address can be used to target directly the canary pods.
|
||||
|
||||
## Expose the app outside the cluster
|
||||
|
||||
@@ -174,11 +169,9 @@ export ADDRESS="$(kubectl -n projectcontour get svc/envoy -ojson \
|
||||
echo $ADDRESS
|
||||
```
|
||||
|
||||
Configure your DNS server with a CNAME record \(AWS\) or A record (GKE/AKS/DOKS)
|
||||
and point a domain e.g. `app.example.com` to the LB address.
|
||||
Configure your DNS server with a CNAME record \(AWS\) or A record \(GKE/AKS/DOKS\) and point a domain e.g. `app.example.com` to the LB address.
|
||||
|
||||
Create a HTTPProxy definition and include the podinfo proxy generated by Flagger
|
||||
(replace `app.example.com` with your own domain):
|
||||
Create a HTTPProxy definition and include the podinfo proxy generated by Flagger \(replace `app.example.com` with your own domain\):
|
||||
|
||||
```yaml
|
||||
apiVersion: projectcontour.io/v1
|
||||
@@ -214,21 +207,17 @@ podinfo-ingress app.example.com valid
|
||||
|
||||
Now you can access podinfo UI using your domain address.
|
||||
|
||||
Note that you should be using HTTPS when exposing production workloads on internet.
|
||||
You can obtain free TLS certs from Let's Encrypt, read this [guide](https://github.com/stefanprodan/eks-contour-ingress)
|
||||
on how to configure cert-manager to secure Contour with TLS certificates.
|
||||
Note that you should be using HTTPS when exposing production workloads on internet. You can obtain free TLS certs from Let's Encrypt, read this [guide](https://github.com/stefanprodan/eks-contour-ingress) on how to configure cert-manager to secure Contour with TLS certificates.
|
||||
|
||||
## Automated canary promotion
|
||||
|
||||
Flagger implements a control loop that gradually shifts traffic to the canary while measuring
|
||||
key performance indicators like HTTP requests success rate, requests average duration and pod health.
|
||||
Based on analysis of the KPIs a canary is promoted or aborted.
|
||||
Flagger implements a control loop that gradually shifts traffic to the canary while measuring key performance indicators like HTTP requests success rate, requests average duration and pod health. Based on analysis of the KPIs a canary is promoted or aborted.
|
||||
|
||||
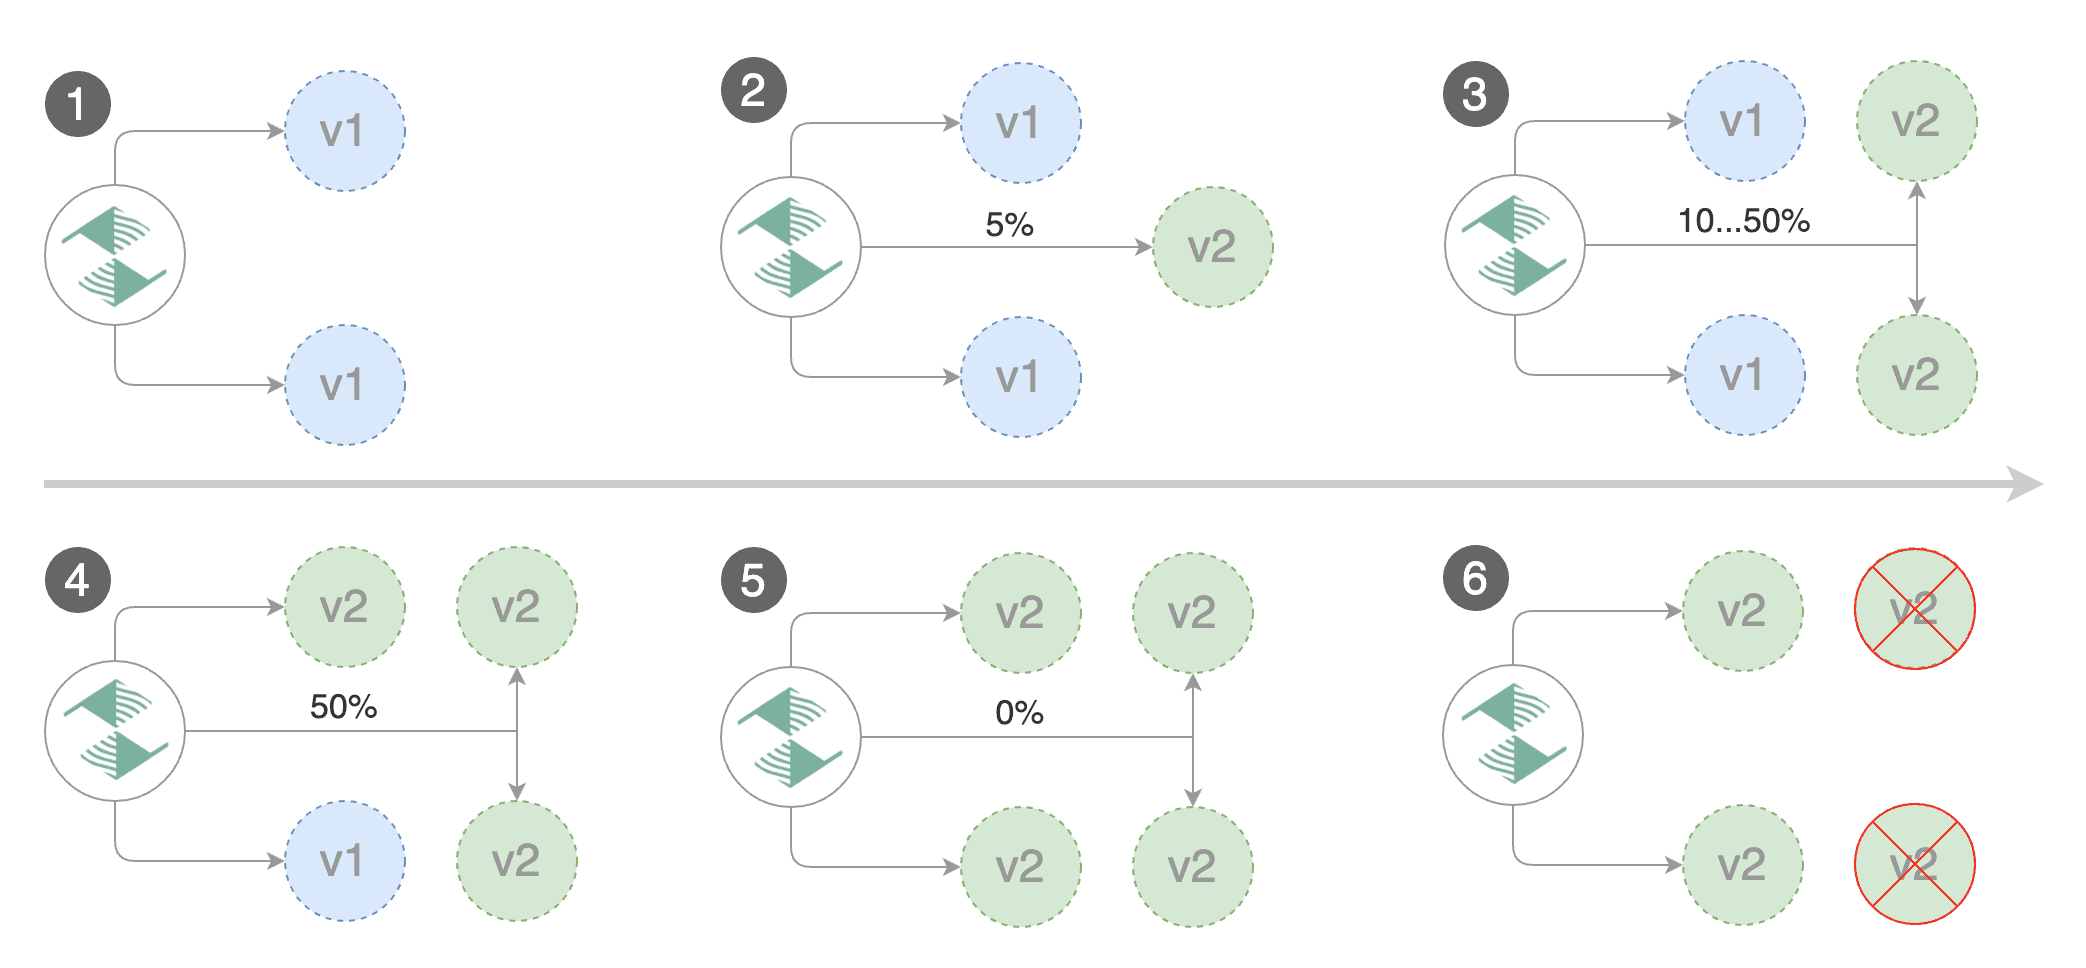
|
||||

|
||||
|
||||
A canary deployment is triggered by changes in any of the following objects:
|
||||
|
||||
* Deployment PodSpec (container image, command, ports, env, resources, etc)
|
||||
* Deployment PodSpec \(container image, command, ports, env, resources, etc\)
|
||||
* ConfigMaps and Secrets mounted as volumes or mapped to environment variables
|
||||
|
||||
Trigger a canary deployment by updating the container image:
|
||||
@@ -282,7 +271,7 @@ test podinfo Progressing 15 2019-12-20T14:05:07Z
|
||||
|
||||
If you’ve enabled the Slack notifications, you should receive the following messages:
|
||||
|
||||

|
||||

|
||||
|
||||
## Automated rollback
|
||||
|
||||
@@ -313,8 +302,7 @@ Generate latency:
|
||||
watch -n 1 curl http://app.example.com/delay/1
|
||||
```
|
||||
|
||||
When the number of failed checks reaches the canary analysis threshold, the traffic is routed back to the primary,
|
||||
the canary is scaled to zero and the rollout is marked as failed.
|
||||
When the number of failed checks reaches the canary analysis threshold, the traffic is routed back to the primary, the canary is scaled to zero and the rollout is marked as failed.
|
||||
|
||||
```text
|
||||
kubectl -n projectcontour logs deploy/flagger -f | jq .msg
|
||||
@@ -333,18 +321,15 @@ Rolling back podinfo.test failed checks threshold reached 5
|
||||
Canary failed! Scaling down podinfo.test
|
||||
```
|
||||
|
||||
If you’ve enabled the Slack notifications, you’ll receive a message if the progress deadline is exceeded,
|
||||
or if the analysis reached the maximum number of failed checks:
|
||||
If you’ve enabled the Slack notifications, you’ll receive a message if the progress deadline is exceeded, or if the analysis reached the maximum number of failed checks:
|
||||
|
||||

|
||||

|
||||
|
||||
## A/B Testing
|
||||
|
||||
Besides weighted routing, Flagger can be configured to route traffic to the canary based on HTTP match conditions.
|
||||
In an A/B testing scenario, you'll be using HTTP headers or cookies to target a certain segment of your users.
|
||||
This is particularly useful for frontend applications that require session affinity.
|
||||
Besides weighted routing, Flagger can be configured to route traffic to the canary based on HTTP match conditions. In an A/B testing scenario, you'll be using HTTP headers or cookies to target a certain segment of your users. This is particularly useful for frontend applications that require session affinity.
|
||||
|
||||

|
||||

|
||||
|
||||
Edit the canary analysis, remove the max/step weight and add the match conditions and iterations:
|
||||
|
||||
@@ -439,3 +424,4 @@ match:
|
||||
```
|
||||
|
||||
For an in-depth look at the analysis process read the [usage docs](../usage/how-it-works.md).
|
||||
|
||||
|
||||
@@ -1,358 +0,0 @@
|
||||
# Crossover Canary Deployments
|
||||
|
||||
This guide shows you how to use Envoy, [Crossover](https://github.com/mumoshu/crossover) and Flagger to automate canary deployments.
|
||||
|
||||
Crossover is a minimal Envoy xDS implementation supports [Service Mesh Interface](https://smi-spec.io/).
|
||||
|
||||
## Prerequisites
|
||||
|
||||
Flagger requires a Kubernetes cluster **v1.11** or newer and Envoy paired with [Crossover](https://github.com/mumoshu/crossover) sidecar.
|
||||
|
||||
Create a test namespace:
|
||||
|
||||
```bash
|
||||
kubectl create ns test
|
||||
```
|
||||
|
||||
Install Envoy along with the Crossover sidecar with Helm:
|
||||
|
||||
```bash
|
||||
helm repo add crossover https://mumoshu.github.io/crossover
|
||||
|
||||
helm upgrade --install envoy crossover/envoy \
|
||||
--namespace test \
|
||||
-f <(cat <<EOF
|
||||
smi:
|
||||
apiVersions:
|
||||
trafficSplits: v1alpha1
|
||||
upstreams:
|
||||
podinfo:
|
||||
smi:
|
||||
enabled: true
|
||||
backends:
|
||||
podinfo-primary:
|
||||
port: 9898
|
||||
weight: 100
|
||||
podinfo-canary:
|
||||
port: 9898
|
||||
weight: 0
|
||||
EOF
|
||||
)
|
||||
```
|
||||
|
||||
Install Flagger and the Prometheus add-on in the same namespace as Envoy:
|
||||
|
||||
```bash
|
||||
helm repo add flagger https://flagger.app
|
||||
|
||||
helm upgrade -i flagger flagger/flagger \
|
||||
--namespace test \
|
||||
--set prometheus.install=true \
|
||||
--set meshProvider=smi:crossover
|
||||
```
|
||||
|
||||
## Bootstrap
|
||||
|
||||
Flagger takes a Kubernetes deployment and optionally a horizontal pod autoscaler (HPA),
|
||||
then creates a series of objects (Kubernetes deployments, ClusterIP services, SMI traffic splits).
|
||||
These objects expose the application on the mesh and drive the canary analysis and promotion.
|
||||
There's no SMI object you need to create by yourself.
|
||||
|
||||
Create a deployment and a horizontal pod autoscaler:
|
||||
|
||||
```bash
|
||||
kubectl apply -k github.com/weaveworks/flagger//kustomize/podinfo
|
||||
```
|
||||
|
||||
Deploy the load testing service to generate traffic during the canary analysis:
|
||||
|
||||
```bash
|
||||
helm upgrade -i flagger-loadtester flagger/loadtester \
|
||||
--namespace=test
|
||||
```
|
||||
|
||||
Create a metric template to measure the HTTP requests error rate:
|
||||
|
||||
```yaml
|
||||
apiVersion: flagger.app/v1beta1
|
||||
kind: MetricTemplate
|
||||
metadata:
|
||||
name: error-rate
|
||||
namespace: test
|
||||
spec:
|
||||
provider:
|
||||
address: http://flagger-prometheus:9090
|
||||
type: prometheus
|
||||
query: |
|
||||
100 - rate(
|
||||
envoy_cluster_upstream_rq{
|
||||
kubernetes_namespace="{{ namespace }}",
|
||||
envoy_cluster_name="{{ target }}-canary",
|
||||
envoy_response_code!~"5.*"
|
||||
}[{{ interval }}])
|
||||
/
|
||||
rate(
|
||||
envoy_cluster_upstream_rq{
|
||||
kubernetes_namespace="{{ namespace }}",
|
||||
envoy_cluster_name="{{ target }}-canary"
|
||||
}[{{ interval }}]
|
||||
) * 100
|
||||
```
|
||||
|
||||
Create a metric template to measure the HTTP requests average duration:
|
||||
|
||||
```yaml
|
||||
apiVersion: flagger.app/v1beta1
|
||||
kind: MetricTemplate
|
||||
metadata:
|
||||
name: latency
|
||||
namespace: test
|
||||
spec:
|
||||
provider:
|
||||
address: http://flagger-prometheus:9090
|
||||
type: prometheus
|
||||
query: |
|
||||
histogram_quantile(0.99,
|
||||
sum(
|
||||
rate(
|
||||
envoy_cluster_upstream_rq_time_bucket{
|
||||
kubernetes_namespace="{{ namespace }}",
|
||||
envoy_cluster_name="{{ target }}-canary"
|
||||
}[{{ interval }}]
|
||||
)
|
||||
) by (le)
|
||||
)
|
||||
```
|
||||
|
||||
Create a canary custom resource:
|
||||
|
||||
```yaml
|
||||
apiVersion: flagger.app/v1beta1
|
||||
kind: Canary
|
||||
metadata:
|
||||
name: podinfo
|
||||
namespace: test
|
||||
spec:
|
||||
provider: "smi:crossover"
|
||||
# deployment reference
|
||||
targetRef:
|
||||
apiVersion: apps/v1
|
||||
kind: Deployment
|
||||
name: podinfo
|
||||
progressDeadlineSeconds: 60
|
||||
# HPA reference (optional)
|
||||
autoscalerRef:
|
||||
apiVersion: autoscaling/v2beta2
|
||||
kind: HorizontalPodAutoscaler
|
||||
name: podinfo
|
||||
service:
|
||||
port: 9898
|
||||
# define the canary analysis timing and KPIs
|
||||
analysis:
|
||||
# schedule interval (default 60s)
|
||||
interval: 1m
|
||||
# max number of failed metric checks before rollback
|
||||
threshold: 5
|
||||
# max traffic percentage routed to canary
|
||||
# percentage (0-100)
|
||||
maxWeight: 50
|
||||
# canary increment step
|
||||
# percentage (0-100)
|
||||
stepWeight: 5
|
||||
metrics:
|
||||
- name: error-rate
|
||||
templateRef:
|
||||
name: error-rate
|
||||
thresholdRange:
|
||||
max: 1
|
||||
interval: 30s
|
||||
- name: latency
|
||||
templateRef:
|
||||
name: latency
|
||||
thresholdRange:
|
||||
max: 0.5
|
||||
interval: 30s
|
||||
webhooks:
|
||||
- name: acceptance-test
|
||||
type: pre-rollout
|
||||
url: http://flagger-loadtester.test/
|
||||
timeout: 30s
|
||||
metadata:
|
||||
type: bash
|
||||
cmd: "curl -sd 'test' http://podinfo-canary.test:9898/token | grep token"
|
||||
- name: load-test
|
||||
url: http://flagger-loadtester.test/
|
||||
timeout: 5s
|
||||
metadata:
|
||||
cmd: "hey -z 1m -q 10 -c 2 -H 'Host: podinfo.test' http://envoy.test:10000/"
|
||||
```
|
||||
|
||||
Save the above resource as podinfo-canary.yaml and then apply it:
|
||||
|
||||
```bash
|
||||
kubectl apply -f ./podinfo-canary.yaml
|
||||
```
|
||||
|
||||
After a couple of seconds Flagger will create the canary objects:
|
||||
|
||||
```bash
|
||||
# applied
|
||||
deployment.apps/podinfo
|
||||
horizontalpodautoscaler.autoscaling/podinfo
|
||||
canary.flagger.app/podinfo
|
||||
|
||||
# generated
|
||||
deployment.apps/podinfo-primary
|
||||
horizontalpodautoscaler.autoscaling/podinfo-primary
|
||||
service/podinfo
|
||||
service/podinfo-canary
|
||||
service/podinfo-primary
|
||||
trafficsplits.split.smi-spec.io/podinfo
|
||||
```
|
||||
|
||||
After the boostrap, the podinfo deployment will be scaled to zero and the traffic to `podinfo.test`
|
||||
will be routed to the primary pods. During the canary analysis,
|
||||
the `podinfo-canary.test` address can be used to target directly the canary pods.
|
||||
|
||||
## Automated canary promotion
|
||||
|
||||
Flagger implements a control loop that gradually shifts traffic to the canary while measuring
|
||||
key performance indicators like HTTP requests success rate, requests average duration and pod health.
|
||||
Based on analysis of the KPIs a canary is promoted or aborted, and the analysis result is published to Slack.
|
||||
|
||||

|
||||
|
||||
A canary deployment is triggered by changes in any of the following objects:
|
||||
|
||||
* Deployment PodSpec (container image, command, ports, env, resources, etc)
|
||||
* ConfigMaps and Secrets mounted as volumes or mapped to environment variables
|
||||
|
||||
Trigger a canary deployment by updating the container image:
|
||||
|
||||
```bash
|
||||
kubectl -n test set image deployment/podinfo \
|
||||
podinfod=stefanprodan/podinfo:3.1.5
|
||||
```
|
||||
|
||||
Flagger detects that the deployment revision changed and starts a new rollout:
|
||||
|
||||
```text
|
||||
kubectl -n test describe canary/podinfo
|
||||
|
||||
Status:
|
||||
Canary Weight: 0
|
||||
Failed Checks: 0
|
||||
Phase: Succeeded
|
||||
Events:
|
||||
New revision detected! Scaling up podinfo.test
|
||||
Waiting for podinfo.test rollout to finish: 0 of 1 updated replicas are available
|
||||
Pre-rollout check acceptance-test passed
|
||||
Advance podinfo.test canary weight 5
|
||||
Advance podinfo.test canary weight 10
|
||||
Advance podinfo.test canary weight 15
|
||||
Advance podinfo.test canary weight 20
|
||||
Advance podinfo.test canary weight 25
|
||||
Advance podinfo.test canary weight 30
|
||||
Advance podinfo.test canary weight 35
|
||||
Advance podinfo.test canary weight 40
|
||||
Advance podinfo.test canary weight 45
|
||||
Advance podinfo.test canary weight 50
|
||||
Copying podinfo.test template spec to podinfo-primary.test
|
||||
Waiting for podinfo-primary.test rollout to finish: 1 of 2 updated replicas are available
|
||||
Routing all traffic to primary
|
||||
Promotion completed! Scaling down podinfo.test
|
||||
```
|
||||
|
||||
When the canary analysis starts, Flagger will call the pre-rollout webhooks before routing traffic to the canary.
|
||||
|
||||
**Note** that if you apply new changes to the deployment during the canary analysis, Flagger will restart the analysis.
|
||||
|
||||
During the analysis the canary’s progress can be monitored with Grafana.
|
||||
|
||||
Flagger comes with a Grafana dashboard made for canary analysis. Install Grafana with Helm:
|
||||
|
||||
```bash
|
||||
helm upgrade -i flagger-grafana flagger/grafana \
|
||||
--namespace=test \
|
||||
--set url=http://flagger-prometheus:9090
|
||||
```
|
||||
|
||||
Run:
|
||||
|
||||
```bash
|
||||
kubectl port-forward --namespace test svc/flagger-grafana 3000:80
|
||||
```
|
||||
|
||||
The Envoy dashboard URL is [http://localhost:3000/d/flagger-envoy/envoy-canary?refresh=10s&orgId=1&var-namespace=test&var-target=podinfo](http://localhost:3000/d/flagger-envoy/envoy-canary?refresh=10s&orgId=1&var-namespace=test&var-target=podinfo)
|
||||
|
||||

|
||||
|
||||
You can monitor all canaries with:
|
||||
|
||||
```bash
|
||||
watch kubectl get canaries --all-namespaces
|
||||
|
||||
NAMESPACE NAME STATUS WEIGHT LASTTRANSITIONTIME
|
||||
test podinfo Progressing 15 2019-10-02T14:05:07Z
|
||||
prod frontend Succeeded 0 2019-10-02T16:15:07Z
|
||||
prod backend Failed 0 2019-10-02T17:05:07Z
|
||||
```
|
||||
|
||||
If you’ve enabled the Slack notifications, you should receive the following messages:
|
||||
|
||||

|
||||
|
||||
## Automated rollback
|
||||
|
||||
During the canary analysis you can generate HTTP 500 errors or high latency to test if Flagger pauses the rollout.
|
||||
|
||||
Trigger a canary deployment:
|
||||
|
||||
```bash
|
||||
kubectl -n test set image deployment/podinfo \
|
||||
podinfod=stefanprodan/podinfo:3.1.2
|
||||
```
|
||||
|
||||
Exec into the load tester pod with:
|
||||
|
||||
```bash
|
||||
kubectl -n test exec -it deploy/flagger-loadtester bash
|
||||
```
|
||||
|
||||
Generate HTTP 500 errors:
|
||||
|
||||
```bash
|
||||
hey -z 1m -c 5 -q 5 -H 'Host: podinfo.test' http://envoy.test:10000/status/500
|
||||
```
|
||||
|
||||
Generate latency:
|
||||
|
||||
```bash
|
||||
watch -n 1 curl -H 'Host: podinfo.test' http://envoy.test:10000/delay/1
|
||||
```
|
||||
|
||||
When the number of failed checks reaches the canary analysis threshold, the traffic is routed back to the primary,
|
||||
the canary is scaled to zero and the rollout is marked as failed.
|
||||
|
||||
```text
|
||||
kubectl -n test logs deploy/flagger -f | jq .msg
|
||||
|
||||
New revision detected! progressing canary analysis for podinfo.test
|
||||
Pre-rollout check acceptance-test passed
|
||||
Advance podinfo.test canary weight 5
|
||||
Advance podinfo.test canary weight 10
|
||||
Advance podinfo.test canary weight 15
|
||||
Halt podinfo.test advancement success rate 69.17% < 99%
|
||||
Halt podinfo.test advancement success rate 61.39% < 99%
|
||||
Halt podinfo.test advancement success rate 55.06% < 99%
|
||||
Halt podinfo.test advancement request duration 1.20s > 0.5s
|
||||
Halt podinfo.test advancement request duration 1.45s > 0.5s
|
||||
Rolling back podinfo.test failed checks threshold reached 5
|
||||
Canary failed! Scaling down podinfo.test
|
||||
```
|
||||
|
||||
If you’ve enabled the Slack notifications, you’ll receive a message if the progress deadline is exceeded,
|
||||
or if the analysis reached the maximum number of failed checks:
|
||||
|
||||

|
||||
|
||||
@@ -1,295 +0,0 @@
|
||||
# SMI Istio Canary Deployments
|
||||
|
||||
This guide shows you how to use the SMI Istio adapter and Flagger to automate canary deployments.
|
||||
|
||||
## Prerequisites
|
||||
|
||||
* Kubernetes > 1.13
|
||||
* Istio > 1.0
|
||||
|
||||
## Install Istio SMI adapter
|
||||
|
||||
Install the SMI adapter:
|
||||
|
||||
```bash
|
||||
kubectl apply -f https://raw.githubusercontent.com/deislabs/smi-adapter-istio/master/deploy/crds/crds.yaml
|
||||
kubectl apply -f https://raw.githubusercontent.com/deislabs/smi-adapter-istio/master/deploy/operator-and-rbac.yaml
|
||||
```
|
||||
|
||||
Create a generic Istio gateway to expose services outside the mesh on HTTP:
|
||||
|
||||
```yaml
|
||||
apiVersion: networking.istio.io/v1alpha3
|
||||
kind: Gateway
|
||||
metadata:
|
||||
name: public-gateway
|
||||
namespace: istio-system
|
||||
spec:
|
||||
selector:
|
||||
istio: ingressgateway
|
||||
servers:
|
||||
- port:
|
||||
number: 80
|
||||
name: http
|
||||
protocol: HTTP
|
||||
hosts:
|
||||
- "*"
|
||||
```
|
||||
|
||||
Save the above resource as public-gateway.yaml and then apply it:
|
||||
|
||||
```bash
|
||||
kubectl apply -f ./public-gateway.yaml
|
||||
```
|
||||
|
||||
Find the Gateway load balancer IP and add a DNS record for it:
|
||||
|
||||
```bash
|
||||
kubectl -n istio-system get svc/istio-ingressgateway -ojson | jq -r .status.loadBalancer.ingress[0].ip
|
||||
```
|
||||
|
||||
## Install Flagger and Grafana
|
||||
|
||||
Add Flagger Helm repository:
|
||||
|
||||
```bash
|
||||
helm repo add flagger https://flagger.app
|
||||
```
|
||||
|
||||
Deploy Flagger in the _**istio-system**_ namespace:
|
||||
|
||||
```bash
|
||||
helm upgrade -i flagger flagger/flagger \
|
||||
--namespace=istio-system \
|
||||
--set meshProvider=smi:istio
|
||||
```
|
||||
|
||||
Flagger comes with a Grafana dashboard made for monitoring the canary deployments.
|
||||
|
||||
Deploy Grafana in the _**istio-system**_ namespace:
|
||||
|
||||
```bash
|
||||
helm upgrade -i flagger-grafana flagger/grafana \
|
||||
--namespace=istio-system \
|
||||
--set url=http://prometheus.istio-system:9090
|
||||
```
|
||||
|
||||
You can access Grafana using port forwarding:
|
||||
|
||||
```bash
|
||||
kubectl -n istio-system port-forward svc/flagger-grafana 3000:80
|
||||
```
|
||||
|
||||
## Workloads bootstrap
|
||||
|
||||
Create a test namespace with Istio sidecar injection enabled:
|
||||
|
||||
Create a test namespace and enable Linkerd proxy injection:
|
||||
|
||||
```bash
|
||||
kubectl create ns test
|
||||
kubectl label namespace test istio-injection=enabled
|
||||
```
|
||||
|
||||
Create a deployment and a horizontal pod autoscaler:
|
||||
|
||||
```bash
|
||||
kubectl apply -k github.com/weaveworks/flagger//kustomize/podinfo
|
||||
```
|
||||
|
||||
Deploy the load testing service to generate traffic during the canary analysis:
|
||||
|
||||
```bash
|
||||
kubectl apply -k github.com/weaveworks/flagger//kustomize/tester
|
||||
```
|
||||
|
||||
Create a canary custom resource \(replace example.com with your own domain\):
|
||||
|
||||
```yaml
|
||||
apiVersion: flagger.app/v1beta1
|
||||
kind: Canary
|
||||
metadata:
|
||||
name: podinfo
|
||||
namespace: test
|
||||
spec:
|
||||
# deployment reference
|
||||
targetRef:
|
||||
apiVersion: apps/v1
|
||||
kind: Deployment
|
||||
name: podinfo
|
||||
# the maximum time in seconds for the canary deployment
|
||||
# to make progress before it is rollback (default 600s)
|
||||
progressDeadlineSeconds: 60
|
||||
# HPA reference (optional)
|
||||
autoscalerRef:
|
||||
apiVersion: autoscaling/v2beta2
|
||||
kind: HorizontalPodAutoscaler
|
||||
name: podinfo
|
||||
service:
|
||||
# container port
|
||||
port: 9898
|
||||
# Istio gateways (optional)
|
||||
gateways:
|
||||
- public-gateway.istio-system.svc.cluster.local
|
||||
# Istio virtual service host names (optional)
|
||||
hosts:
|
||||
- app.example.com
|
||||
analysis:
|
||||
# schedule interval (default 60s)
|
||||
interval: 10s
|
||||
# max number of failed metric checks before rollback
|
||||
threshold: 5
|
||||
# max traffic percentage routed to canary
|
||||
# percentage (0-100)
|
||||
maxWeight: 50
|
||||
# canary increment step
|
||||
# percentage (0-100)
|
||||
stepWeight: 10
|
||||
metrics:
|
||||
- name: request-success-rate
|
||||
# minimum req success rate (non 5xx responses)
|
||||
# percentage (0-100)
|
||||
thresholdRange:
|
||||
min: 99
|
||||
interval: 1m
|
||||
- name: request-duration
|
||||
# maximum req duration P99
|
||||
# milliseconds
|
||||
thresholdRange:
|
||||
max: 500
|
||||
interval: 30s
|
||||
# generate traffic during analysis
|
||||
webhooks:
|
||||
- name: load-test
|
||||
url: http://flagger-loadtester.test/
|
||||
timeout: 5s
|
||||
metadata:
|
||||
cmd: "hey -z 1m -q 10 -c 2 http://podinfo.test:9898/"
|
||||
```
|
||||
|
||||
Save the above resource as podinfo-canary.yaml and then apply it:
|
||||
|
||||
```bash
|
||||
kubectl apply -f ./podinfo-canary.yaml
|
||||
```
|
||||
|
||||
After a couple of seconds Flagger will create the canary objects:
|
||||
|
||||
```bash
|
||||
# applied
|
||||
deployment.apps/podinfo
|
||||
horizontalpodautoscaler.autoscaling/podinfo
|
||||
canary.flagger.app/podinfo
|
||||
|
||||
# generated
|
||||
deployment.apps/podinfo-primary
|
||||
horizontalpodautoscaler.autoscaling/podinfo-primary
|
||||
service/podinfo
|
||||
service/podinfo-canary
|
||||
service/podinfo-primary
|
||||
trafficsplits.split.smi-spec.io/podinfo
|
||||
```
|
||||
|
||||
## Automated canary promotion
|
||||
|
||||
Flagger implements a control loop that gradually shifts traffic to the canary while measuring key performance indicators like HTTP requests success rate, requests average duration and pod health. Based on analysis of the KPIs a canary is promoted or aborted, and the analysis result is published to Slack.
|
||||
|
||||

|
||||
|
||||
Trigger a canary deployment by updating the container image:
|
||||
|
||||
```bash
|
||||
kubectl -n test set image deployment/podinfo \
|
||||
podinfod=quay.io/stefanprodan/podinfo:3.1.1
|
||||
```
|
||||
|
||||
Flagger detects that the deployment revision changed and starts a new rollout:
|
||||
|
||||
```text
|
||||
kubectl -n istio-system logs deployment/flagger -f | jq .msg
|
||||
|
||||
|
||||
New revision detected podinfo.test
|
||||
Scaling up podinfo.test
|
||||
Waiting for podinfo.test rollout to finish: 0 of 1 updated replicas are available
|
||||
Advance podinfo.test canary weight 5
|
||||
Advance podinfo.test canary weight 10
|
||||
Advance podinfo.test canary weight 15
|
||||
Advance podinfo.test canary weight 20
|
||||
Advance podinfo.test canary weight 25
|
||||
Advance podinfo.test canary weight 30
|
||||
Advance podinfo.test canary weight 35
|
||||
Advance podinfo.test canary weight 40
|
||||
Advance podinfo.test canary weight 45
|
||||
Advance podinfo.test canary weight 50
|
||||
Copying podinfo.test template spec to podinfo-primary.test
|
||||
Waiting for podinfo-primary.test rollout to finish: 1 of 2 updated replicas are available
|
||||
Promotion completed! Scaling down podinfo.test
|
||||
```
|
||||
|
||||
**Note** that if you apply new changes to the deployment during the canary analysis, Flagger will restart the analysis.
|
||||
|
||||
During the analysis the canary’s progress can be monitored with Grafana. The Istio dashboard URL is [http://localhost:3000/d/flagger-istio/istio-canary?refresh=10s&orgId=1&var-namespace=test&var-primary=podinfo-primary&var-canary=podinfo](http://localhost:3000/d/flagger-istio/istio-canary?refresh=10s&orgId=1&var-namespace=test&var-primary=podinfo-primary&var-canary=podinfo)
|
||||
|
||||
You can monitor all canaries with:
|
||||
|
||||
```bash
|
||||
watch kubectl get canaries --all-namespaces
|
||||
|
||||
NAMESPACE NAME STATUS WEIGHT LASTTRANSITIONTIME
|
||||
test podinfo Progressing 15 2019-05-16T14:05:07Z
|
||||
prod frontend Succeeded 0 2019-05-15T16:15:07Z
|
||||
prod backend Failed 0 2019-05-14T17:05:07Z
|
||||
```
|
||||
|
||||
## Automated rollback
|
||||
|
||||
During the canary analysis you can generate HTTP 500 errors and high latency to test if Flagger pauses the rollout.
|
||||
|
||||
Create a tester pod and exec into it:
|
||||
|
||||
```bash
|
||||
kubectl -n test run tester \
|
||||
--image=quay.io/stefanprodan/podinfo:3.1.2 \
|
||||
-- ./podinfo --port=9898
|
||||
|
||||
kubectl -n test exec -it tester-xx-xx sh
|
||||
```
|
||||
|
||||
Generate HTTP 500 errors:
|
||||
|
||||
```bash
|
||||
watch curl http://podinfo-canary:9898/status/500
|
||||
```
|
||||
|
||||
Generate latency:
|
||||
|
||||
```bash
|
||||
watch curl http://podinfo-canary:9898/delay/1
|
||||
```
|
||||
|
||||
When the number of failed checks reaches the canary analysis threshold, the traffic is routed back to the primary, the canary is scaled to zero and the rollout is marked as failed.
|
||||
|
||||
```text
|
||||
kubectl -n test describe canary/podinfo
|
||||
|
||||
Status:
|
||||
Canary Weight: 0
|
||||
Failed Checks: 10
|
||||
Phase: Failed
|
||||
Events:
|
||||
Type Reason Age From Message
|
||||
---- ------ ---- ---- -------
|
||||
Normal Synced 3m flagger Starting canary deployment for podinfo.test
|
||||
Normal Synced 3m flagger Advance podinfo.test canary weight 5
|
||||
Normal Synced 3m flagger Advance podinfo.test canary weight 10
|
||||
Normal Synced 3m flagger Advance podinfo.test canary weight 15
|
||||
Normal Synced 3m flagger Halt podinfo.test advancement success rate 69.17% < 99%
|
||||
Normal Synced 2m flagger Halt podinfo.test advancement success rate 61.39% < 99%
|
||||
Normal Synced 2m flagger Halt podinfo.test advancement success rate 55.06% < 99%
|
||||
Normal Synced 2m flagger Halt podinfo.test advancement success rate 47.00% < 99%
|
||||
Normal Synced 2m flagger (combined from similar events): Halt podinfo.test advancement success rate 38.08% < 99%
|
||||
Warning Synced 1m flagger Rolling back podinfo.test failed checks threshold reached 10
|
||||
Warning Synced 1m flagger Canary failed! Scaling down podinfo.test
|
||||
```
|
||||
|
||||
@@ -1,12 +1,17 @@
|
||||
# Gloo Canary Deployments
|
||||
|
||||
This guide shows you how to use the [Gloo](https://gloo.solo.io/) ingress controller and Flagger to automate canary deployments.
|
||||
This guide shows you how to use the [Gloo Edge](https://gloo.solo.io/) ingress controller
|
||||
and Flagger to automate canary releases and A/B testing.
|
||||
|
||||

|
||||
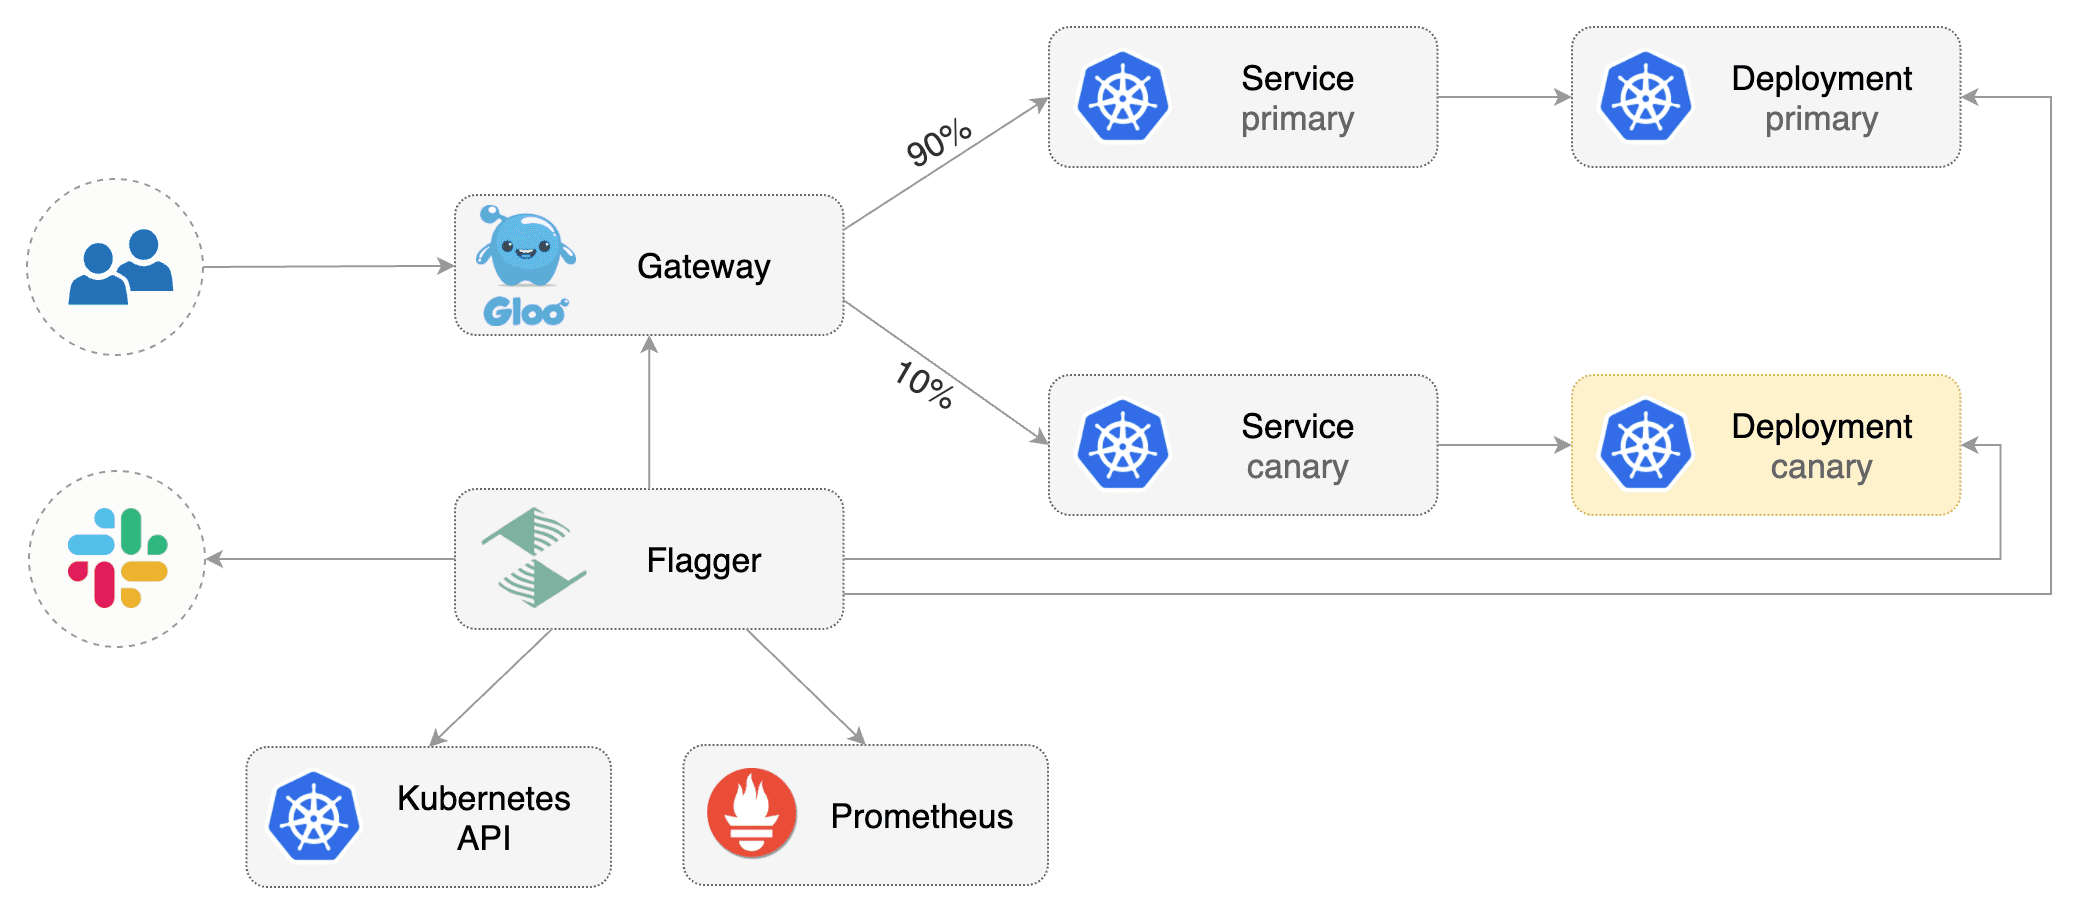
|
||||
|
||||
## Prerequisites
|
||||
|
||||
Flagger requires a Kubernetes cluster **v1.11** or newer and Gloo ingress **1.3.5** or newer.
|
||||
Flagger requires a Kubernetes cluster **v1.16** or newer and Gloo Edge ingress **1.6.0** or newer.
|
||||
|
||||
This guide was written for Flagger version **1.6.0** or higher. Prior versions of Flagger
|
||||
used Gloo `UpstreamGroup`s to handle canaries, but newer versions of Flagger use Gloo
|
||||
`RouteTable`s to handle canaries as well as A/B testing.
|
||||
|
||||
Install Gloo with Helm v3:
|
||||
|
||||
@@ -31,7 +36,7 @@ helm upgrade -i flagger flagger/flagger \
|
||||
## Bootstrap
|
||||
|
||||
Flagger takes a Kubernetes deployment and optionally a horizontal pod autoscaler (HPA),
|
||||
then creates a series of objects (Kubernetes deployments, ClusterIP services and Gloo upstream groups).
|
||||
then creates a series of objects (Kubernetes deployments, ClusterIP services, Gloo route tables and upstreams).
|
||||
These objects expose the application outside the cluster and drive the canary analysis and promotion.
|
||||
|
||||
Create a test namespace:
|
||||
@@ -43,16 +48,16 @@ kubectl create ns test
|
||||
Create a deployment and a horizontal pod autoscaler:
|
||||
|
||||
```bash
|
||||
kubectl -n test apply -k github.com/weaveworks/flagger//kustomize/podinfo
|
||||
kubectl -n test apply -k https://github.com/fluxcd/flagger//kustomize/podinfo?ref=main
|
||||
```
|
||||
|
||||
Deploy the load testing service to generate traffic during the canary analysis:
|
||||
|
||||
```bash
|
||||
kubectl -n test apply -k github.com/weaveworks/flagger//kustomize/tester
|
||||
kubectl -n test apply -k https://github.com/fluxcd/flagger//kustomize/tester?ref=main
|
||||
```
|
||||
|
||||
Create an virtual service definition that references an upstream group that will be generated by Flagger
|
||||
Create a virtual service definition that references a route table that will be generated by Flagger
|
||||
(replace `app.example.com` with your own domain):
|
||||
|
||||
```yaml
|
||||
@@ -68,8 +73,8 @@ spec:
|
||||
routes:
|
||||
- matchers:
|
||||
- prefix: /
|
||||
routeAction:
|
||||
upstreamGroup:
|
||||
delegateAction:
|
||||
ref:
|
||||
name: podinfo
|
||||
namespace: test
|
||||
```
|
||||
@@ -89,6 +94,14 @@ metadata:
|
||||
name: podinfo
|
||||
namespace: test
|
||||
spec:
|
||||
# upstreamRef (optional)
|
||||
# defines an upstream to copy the spec from when flagger generates new upstreams.
|
||||
# necessary to copy over TLS config, circuit breakers, etc. (anything nonstandard)
|
||||
# upstreamRef:
|
||||
# apiVersion: gloo.solo.io/v1
|
||||
# kind: Upstream
|
||||
# name: podinfo-upstream
|
||||
# namespace: gloo-system
|
||||
provider: gloo
|
||||
# deployment reference
|
||||
targetRef:
|
||||
@@ -168,7 +181,9 @@ horizontalpodautoscaler.autoscaling/podinfo-primary
|
||||
service/podinfo
|
||||
service/podinfo-canary
|
||||
service/podinfo-primary
|
||||
upstreamgroups.gloo.solo.io/podinfo
|
||||
routetables.gateway.solo.io/podinfo
|
||||
upstreams.gloo.solo.io/test-podinfo-canaryupstream-9898
|
||||
upstreams.gloo.solo.io/test-podinfo-primaryupstream-9898
|
||||
```
|
||||
|
||||
When the bootstrap finishes Flagger will set the canary status to initialized:
|
||||
@@ -186,7 +201,7 @@ Flagger implements a control loop that gradually shifts traffic to the canary wh
|
||||
key performance indicators like HTTP requests success rate, requests average duration and pod health.
|
||||
Based on analysis of the KPIs a canary is promoted or aborted, and the analysis result is published to Slack.
|
||||
|
||||

|
||||

|
||||
|
||||
Trigger a canary deployment by updating the container image:
|
||||
|
||||
@@ -240,7 +255,8 @@ prod backend Failed 0 2019-05-17T17:05:07Z
|
||||
|
||||
## Automated rollback
|
||||
|
||||
During the canary analysis you can generate HTTP 500 errors and high latency to test if Flagger pauses and rolls back the faulted version.
|
||||
During the canary analysis you can generate HTTP 500 errors and high latency to test if
|
||||
Flagger pauses and rolls back the faulted version.
|
||||
|
||||
Trigger another canary deployment:
|
||||
|
||||
@@ -252,13 +268,13 @@ podinfod=stefanprodan/podinfo:3.1.2
|
||||
Generate HTTP 500 errors:
|
||||
|
||||
```bash
|
||||
watch curl -H 'Host: app.example.com' http://gateway-proxy-v2.gloo-system/status/500
|
||||
watch curl -H 'Host: app.example.com' http://gateway-proxy.gloo-system/status/500
|
||||
```
|
||||
|
||||
Generate high latency:
|
||||
|
||||
```bash
|
||||
watch curl -H 'Host: app.example.com' http://gateway-proxy-v2.gloo-system/delay/2
|
||||
watch curl -H 'Host: app.example.com' http://gateway-proxy.gloo-system/delay/2
|
||||
```
|
||||
|
||||
When the number of failed checks reaches the canary analysis threshold, the traffic is routed back to the primary,
|
||||
@@ -291,8 +307,8 @@ Events:
|
||||
|
||||
The canary analysis can be extended with Prometheus queries.
|
||||
|
||||
The demo app is instrumented with Prometheus so you can create a custom check that will use
|
||||
the HTTP request duration histogram to validate the canary.
|
||||
The demo app is instrumented with Prometheus so you can create a custom check that will use the HTTP request
|
||||
duration histogram to validate the canary.
|
||||
|
||||
Create a metric template and apply it on the cluster:
|
||||
|
||||
@@ -340,8 +356,8 @@ Edit the canary analysis and add the following metric:
|
||||
interval: 1m
|
||||
```
|
||||
|
||||
The above configuration validates the canary by checking if the HTTP 404 req/sec percentage is
|
||||
below 5 percent of the total traffic. If the 404s rate reaches the 5% threshold, then the canary fails.
|
||||
The above configuration validates the canary by checking if the HTTP 404 req/sec percentage
|
||||
is below 5 percent of the total traffic. If the 404s rate reaches the 5% threshold, then the canary fails.
|
||||
|
||||
Trigger a canary deployment by updating the container image:
|
||||
|
||||
@@ -353,7 +369,7 @@ podinfod=stefanprodan/podinfo:3.1.3
|
||||
Generate 404s:
|
||||
|
||||
```bash
|
||||
watch curl -H 'Host: app.example.com' http://gateway-proxy.gloo-system/status/400
|
||||
watch curl -H 'Host: app.example.com' http://gateway-proxy.gloo-system/status/404
|
||||
```
|
||||
|
||||
Watch Flagger logs:
|
||||
@@ -377,5 +393,90 @@ Canary failed! Scaling down podinfo.test
|
||||
If you have [alerting](../usage/alerting.md) configured,
|
||||
Flagger will send a notification with the reason why the canary failed.
|
||||
|
||||
For an in-depth look at the analysis process read the [usage docs](../usage/how-it-works.md).
|
||||
## A/B Testing
|
||||
|
||||
Besides weighted routing, Flagger can be configured to route traffic to the canary based on HTTP match conditions.
|
||||
In an A/B testing scenario, you'll be using HTTP headers or cookies to target a certain segment of your users.
|
||||
This is particularly useful for frontend applications that require session affinity.
|
||||
|
||||

|
||||
|
||||
Edit the canary analysis, remove the max/step weight and add the match conditions and iterations:
|
||||
|
||||
```yaml
|
||||
analysis:
|
||||
interval: 1m
|
||||
threshold: 5
|
||||
iterations: 10
|
||||
match:
|
||||
- headers:
|
||||
x-canary:
|
||||
exact: "insider"
|
||||
webhooks:
|
||||
- name: load-test
|
||||
url: http://flagger-loadtester.test/
|
||||
metadata:
|
||||
cmd: "hey -z 1m -q 5 -c 5 -H 'X-Canary: insider' -host app.example.com http://gateway-proxy.gloo-system"
|
||||
```
|
||||
|
||||
The above configuration will run an analysis for ten minutes targeting users that have a `X-Canary: insider` header.
|
||||
|
||||
Trigger a canary deployment by updating the container image:
|
||||
|
||||
```bash
|
||||
kubectl -n test set image deployment/podinfo \
|
||||
podinfod=stefanprodan/podinfo:3.1.4
|
||||
```
|
||||
|
||||
Flagger detects that the deployment revision changed and starts the A/B test:
|
||||
|
||||
```text
|
||||
kubectl -n gloo-system logs deploy/flagger -f | jq .msg
|
||||
|
||||
New revision detected! Progressing canary analysis for podinfo.test
|
||||
Advance podinfo.test canary iteration 1/10
|
||||
Advance podinfo.test canary iteration 2/10
|
||||
Advance podinfo.test canary iteration 3/10
|
||||
Advance podinfo.test canary iteration 4/10
|
||||
Advance podinfo.test canary iteration 5/10
|
||||
Advance podinfo.test canary iteration 6/10
|
||||
Advance podinfo.test canary iteration 7/10
|
||||
Advance podinfo.test canary iteration 8/10
|
||||
Advance podinfo.test canary iteration 9/10
|
||||
Advance podinfo.test canary iteration 10/10
|
||||
Copying podinfo.test template spec to podinfo-primary.test
|
||||
Waiting for podinfo-primary.test rollout to finish: 1 of 2 updated replicas are available
|
||||
Routing all traffic to primary
|
||||
Promotion completed! Scaling down podinfo.test
|
||||
```
|
||||
|
||||
The web browser user agent header allows user segmentation based on device or OS.
|
||||
|
||||
For example, if you want to route all mobile users to the canary instance:
|
||||
|
||||
```yaml
|
||||
match:
|
||||
- headers:
|
||||
user-agent:
|
||||
regex: ".*Mobile.*"
|
||||
```
|
||||
|
||||
Or if you want to target only Android users:
|
||||
|
||||
```yaml
|
||||
match:
|
||||
- headers:
|
||||
user-agent:
|
||||
regex: ".*Android.*"
|
||||
```
|
||||
|
||||
Or a specific browser version:
|
||||
|
||||
```yaml
|
||||
match:
|
||||
- headers:
|
||||
user-agent:
|
||||
regex: ".*Firefox.*"
|
||||
```
|
||||
|
||||
For an in-depth look at the analysis process read the [usage docs](../usage/how-it-works.md).
|
||||
|
||||
@@ -2,15 +2,13 @@
|
||||
|
||||
This guide shows you how to automate A/B testing with Istio and Flagger.
|
||||
|
||||
Besides weighted routing, Flagger can be configured to route traffic to the canary based on HTTP match conditions.
|
||||
In an A/B testing scenario, you'll be using HTTP headers or cookies to target a certain segment of your users.
|
||||
This is particularly useful for frontend applications that require session affinity.
|
||||
Besides weighted routing, Flagger can be configured to route traffic to the canary based on HTTP match conditions. In an A/B testing scenario, you'll be using HTTP headers or cookies to target a certain segment of your users. This is particularly useful for frontend applications that require session affinity.
|
||||
|
||||

|
||||

|
||||
|
||||
## Prerequisites
|
||||
|
||||
Flagger requires a Kubernetes cluster **v1.14** or newer and Istio **v1.0** or newer.
|
||||
Flagger requires a Kubernetes cluster **v1.16** or newer and Istio **v1.0** or newer.
|
||||
|
||||
Install Istio with telemetry support and Prometheus:
|
||||
|
||||
@@ -23,7 +21,7 @@ kubectl apply -f https://raw.githubusercontent.com/istio/istio/release-1.8/sampl
|
||||
Install Flagger in the `istio-system` namespace:
|
||||
|
||||
```bash
|
||||
kubectl apply -k github.com/weaveworks/flagger//kustomize/istio
|
||||
kubectl apply -k github.com/fluxcd/flagger//kustomize/istio
|
||||
```
|
||||
|
||||
Create an ingress gateway to expose the demo app outside of the mesh:
|
||||
@@ -58,16 +56,16 @@ kubectl label namespace test istio-injection=enabled
|
||||
Create a deployment and a horizontal pod autoscaler:
|
||||
|
||||
```bash
|
||||
kubectl apply -k github.com/weaveworks/flagger//kustomize/podinfo
|
||||
kubectl apply -k https://github.com/fluxcd/flagger//kustomize/podinfo?ref=main
|
||||
```
|
||||
|
||||
Deploy the load testing service to generate traffic during the canary analysis:
|
||||
|
||||
```bash
|
||||
kubectl apply -k github.com/weaveworks/flagger//kustomize/tester
|
||||
kubectl apply -k https://github.com/fluxcd/flagger//kustomize/tester?ref=main
|
||||
```
|
||||
|
||||
Create a canary custom resource (replace example.com with your own domain):
|
||||
Create a canary custom resource \(replace example.com with your own domain\):
|
||||
|
||||
```yaml
|
||||
apiVersion: flagger.app/v1beta1
|
||||
@@ -140,8 +138,7 @@ spec:
|
||||
cmd: "hey -z 1m -q 10 -c 2 -H 'Cookie: type=insider' http://podinfo.test:9898/"
|
||||
```
|
||||
|
||||
**Note** that when using Istio 1.5 you have to replace the `request-duration`
|
||||
with a [metric template](https://docs.flagger.app/dev/upgrade-guide#istio-telemetry-v2).
|
||||
**Note** that when using Istio 1.5 you have to replace the `request-duration` with a [metric template](https://docs.flagger.app/dev/upgrade-guide#istio-telemetry-v2).
|
||||
|
||||
The above configuration will run an analysis for ten minutes targeting Firefox users and those that have an insider cookie.
|
||||
|
||||
@@ -237,8 +234,7 @@ Generate latency:
|
||||
watch curl -b 'type=insider' http://app.example.com/delay/1
|
||||
```
|
||||
|
||||
When the number of failed checks reaches the canary analysis threshold, the traffic is routed back to the primary,
|
||||
the canary is scaled to zero and the rollout is marked as failed.
|
||||
When the number of failed checks reaches the canary analysis threshold, the traffic is routed back to the primary, the canary is scaled to zero and the rollout is marked as failed.
|
||||
|
||||
```text
|
||||
kubectl -n test describe canary/podinfo
|
||||
@@ -259,7 +255,5 @@ Events:
|
||||
Warning Synced 1m flagger Canary failed! Scaling down podinfo.test
|
||||
```
|
||||
|
||||
The above procedure can be extended with [custom metrics](../usage/metrics.md) checks,
|
||||
[webhooks](../usage/webhooks.md),
|
||||
[manual promotion](../usage/webhooks.md#manual-gating) approval and
|
||||
[Slack or MS Teams](../usage/alerting.md) notifications.
|
||||
The above procedure can be extended with [custom metrics](../usage/metrics.md) checks, [webhooks](../usage/webhooks.md), [manual promotion](../usage/webhooks.md#manual-gating) approval and [Slack or MS Teams](../usage/alerting.md) notifications.
|
||||
|
||||
|
||||
@@ -2,11 +2,11 @@
|
||||
|
||||
This guide shows you how to use Istio and Flagger to automate canary deployments.
|
||||
|
||||

|
||||

|
||||
|
||||
## Prerequisites
|
||||
|
||||
Flagger requires a Kubernetes cluster **v1.14** or newer and Istio **v1.5** or newer.
|
||||
Flagger requires a Kubernetes cluster **v1.16** or newer and Istio **v1.5** or newer.
|
||||
|
||||
Install Istio with telemetry support and Prometheus:
|
||||
|
||||
@@ -19,7 +19,7 @@ kubectl apply -f https://raw.githubusercontent.com/istio/istio/release-1.8/sampl
|
||||
Install Flagger in the `istio-system` namespace:
|
||||
|
||||
```bash
|
||||
kubectl apply -k github.com/weaveworks/flagger//kustomize/istio
|
||||
kubectl apply -k github.com/fluxcd/flagger//kustomize/istio
|
||||
```
|
||||
|
||||
Create an ingress gateway to expose the demo app outside of the mesh:
|
||||
@@ -44,10 +44,7 @@ spec:
|
||||
|
||||
## Bootstrap
|
||||
|
||||
Flagger takes a Kubernetes deployment and optionally a horizontal pod autoscaler (HPA),
|
||||
then creates a series of objects (Kubernetes deployments, ClusterIP services,
|
||||
Istio destination rules and virtual services).
|
||||
These objects expose the application inside the mesh and drive the canary analysis and promotion.
|
||||
Flagger takes a Kubernetes deployment and optionally a horizontal pod autoscaler \(HPA\), then creates a series of objects \(Kubernetes deployments, ClusterIP services, Istio destination rules and virtual services\). These objects expose the application inside the mesh and drive the canary analysis and promotion.
|
||||
|
||||
Create a test namespace with Istio sidecar injection enabled:
|
||||
|
||||
@@ -59,16 +56,16 @@ kubectl label namespace test istio-injection=enabled
|
||||
Create a deployment and a horizontal pod autoscaler:
|
||||
|
||||
```bash
|
||||
kubectl apply -k github.com/weaveworks/flagger//kustomize/podinfo
|
||||
kubectl apply -k https://github.com/fluxcd/flagger//kustomize/podinfo?ref=main
|
||||
```
|
||||
|
||||
Deploy the load testing service to generate traffic during the canary analysis:
|
||||
|
||||
```bash
|
||||
kubectl apply -k github.com/weaveworks/flagger//kustomize/tester
|
||||
kubectl apply -k https://github.com/fluxcd/flagger//kustomize/tester?ref=main
|
||||
```
|
||||
|
||||
Create a canary custom resource (replace example.com with your own domain):
|
||||
Create a canary custom resource \(replace example.com with your own domain\):
|
||||
|
||||
```yaml
|
||||
apiVersion: flagger.app/v1beta1
|
||||
@@ -151,8 +148,7 @@ spec:
|
||||
cmd: "hey -z 1m -q 10 -c 2 http://podinfo-canary.test:9898/"
|
||||
```
|
||||
|
||||
**Note** that when using Istio 1.4 you have to replace the `request-duration`
|
||||
with a [metric template](https://docs.flagger.app/dev/upgrade-guide#istio-telemetry-v2).
|
||||
**Note** that when using Istio 1.4 you have to replace the `request-duration` with a [metric template](https://docs.flagger.app/dev/upgrade-guide#istio-telemetry-v2).
|
||||
|
||||
Save the above resource as podinfo-canary.yaml and then apply it:
|
||||
|
||||
@@ -160,10 +156,9 @@ Save the above resource as podinfo-canary.yaml and then apply it:
|
||||
kubectl apply -f ./podinfo-canary.yaml
|
||||
```
|
||||
|
||||
When the canary analysis starts, Flagger will call the pre-rollout webhooks before routing traffic to the canary.
|
||||
The canary analysis will run for five minutes while validating the HTTP metrics and rollout hooks every minute.
|
||||
When the canary analysis starts, Flagger will call the pre-rollout webhooks before routing traffic to the canary. The canary analysis will run for five minutes while validating the HTTP metrics and rollout hooks every minute.
|
||||
|
||||

|
||||
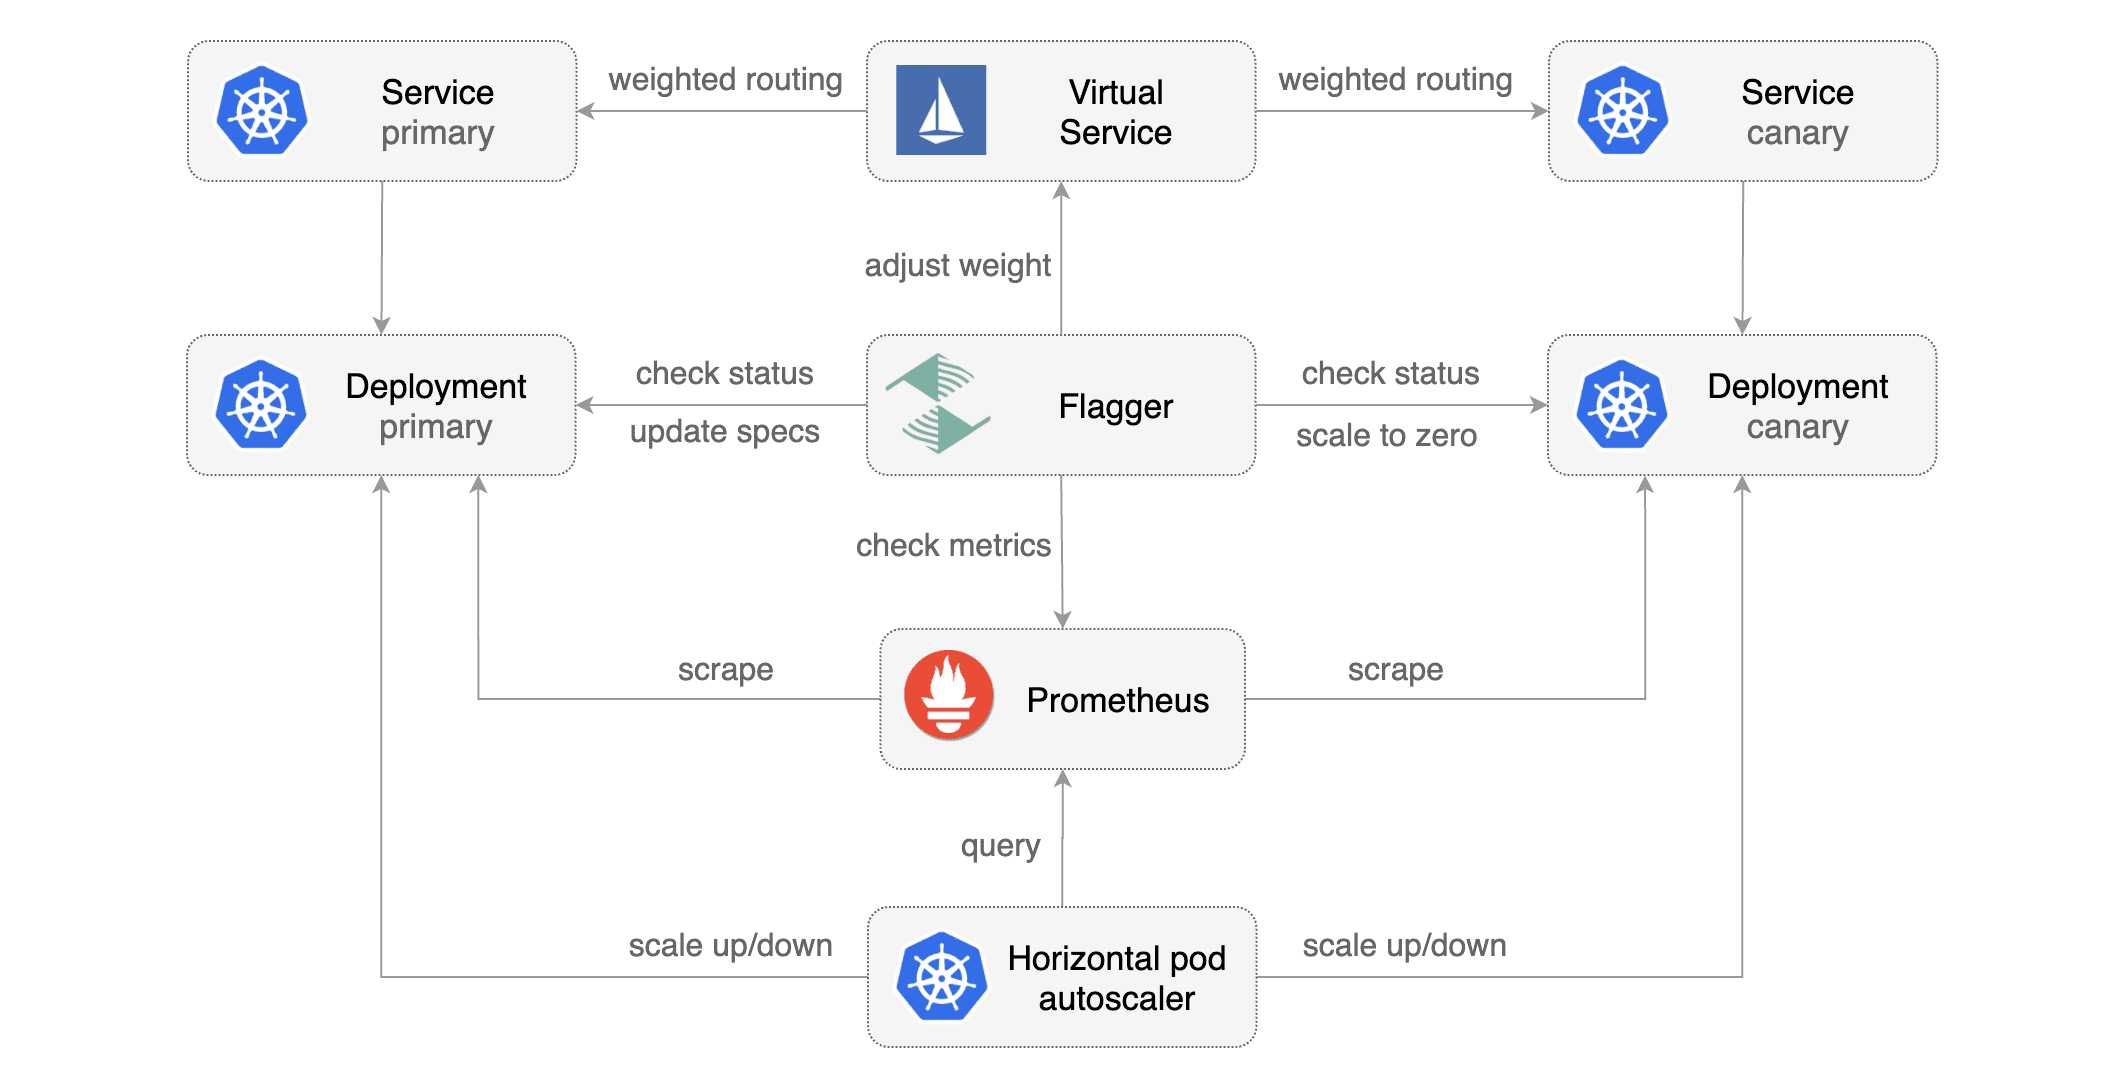
|
||||
|
||||
After a couple of seconds Flagger will create the canary objects:
|
||||
|
||||
@@ -271,8 +266,7 @@ Generate latency:
|
||||
watch curl http://podinfo-canary:9898/delay/1
|
||||
```
|
||||
|
||||
When the number of failed checks reaches the canary analysis threshold, the traffic is routed back to the primary,
|
||||
the canary is scaled to zero and the rollout is marked as failed.
|
||||
When the number of failed checks reaches the canary analysis threshold, the traffic is routed back to the primary, the canary is scaled to zero and the rollout is marked as failed.
|
||||
|
||||
```text
|
||||
kubectl -n test describe canary/podinfo
|
||||
@@ -299,14 +293,11 @@ Events:
|
||||
|
||||
## Traffic mirroring
|
||||
|
||||

|
||||
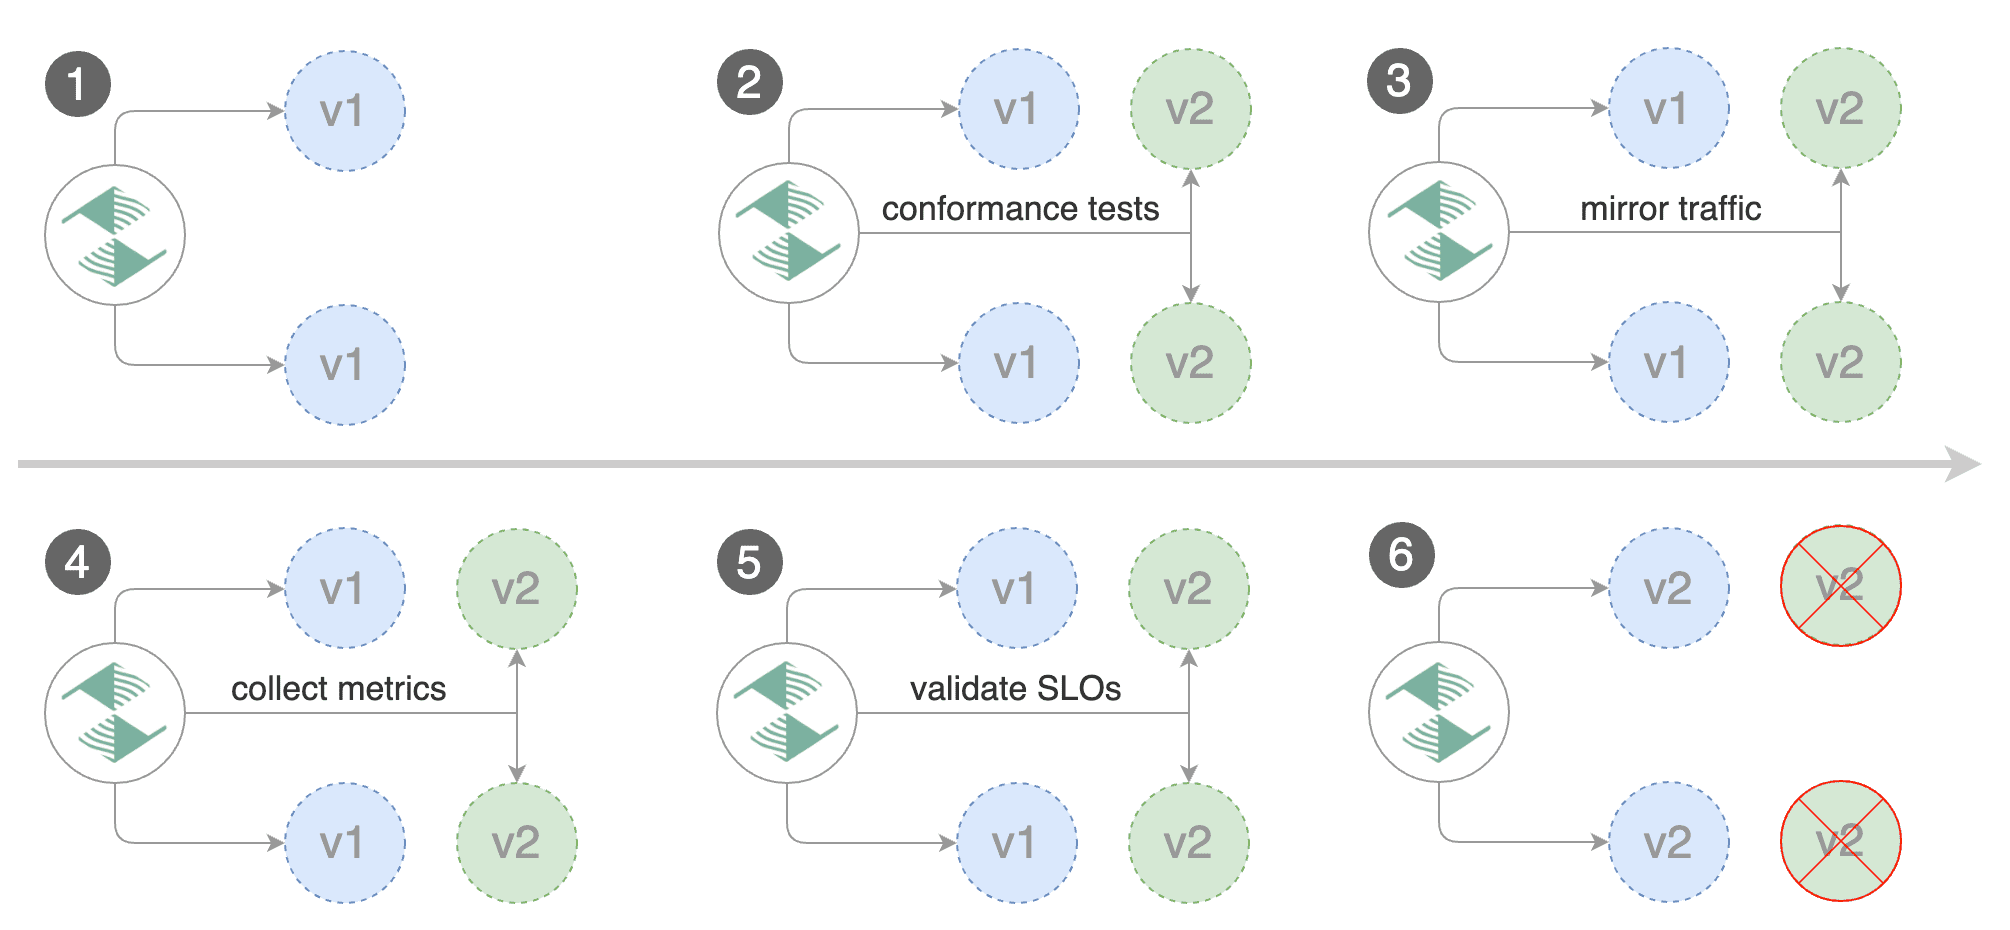
|
||||
|
||||
For applications that perform read operations, Flagger can be configured to drive canary releases with traffic mirroring.
|
||||
Istio traffic mirroring will copy each incoming request, sending one request to the primary and one to the canary service.
|
||||
The response from the primary is sent back to the user and the response from the canary is discarded.
|
||||
Metrics are collected on both requests so that the deployment will only proceed if the canary metrics are within the threshold values.
|
||||
For applications that perform read operations, Flagger can be configured to drive canary releases with traffic mirroring. Istio traffic mirroring will copy each incoming request, sending one request to the primary and one to the canary service. The response from the primary is sent back to the user and the response from the canary is discarded. Metrics are collected on both requests so that the deployment will only proceed if the canary metrics are within the threshold values.
|
||||
|
||||
Note that mirroring should be used for requests that are **idempotent** or capable of being processed twice (once by the primary and once by the canary).
|
||||
Note that mirroring should be used for requests that are **idempotent** or capable of being processed twice \(once by the primary and once by the canary\).
|
||||
|
||||
You can enable mirroring by replacing `stepWeight/maxWeight` with `iterations` and by setting `analysis.mirror` to `true`:
|
||||
|
||||
@@ -354,7 +345,7 @@ spec:
|
||||
|
||||
With the above configuration, Flagger will run a canary release with the following steps:
|
||||
|
||||
* detect new revision (deployment spec, secrets or configmaps changes)
|
||||
* detect new revision \(deployment spec, secrets or configmaps changes\)
|
||||
* scale from zero the canary deployment
|
||||
* wait for the HPA to set the canary minimum replicas
|
||||
* check canary pods health
|
||||
@@ -366,7 +357,7 @@ With the above configuration, Flagger will run a canary release with the followi
|
||||
* abort the canary release if the metrics check failure threshold is reached
|
||||
* stop traffic mirroring after the number of iterations is reached
|
||||
* route live traffic to the canary pods
|
||||
* promote the canary (update the primary secrets, configmaps and deployment spec)
|
||||
* promote the canary \(update the primary secrets, configmaps and deployment spec\)
|
||||
* wait for the primary deployment rollout to finish
|
||||
* wait for the HPA to set the primary minimum replicas
|
||||
* check primary pods health
|
||||
@@ -374,7 +365,5 @@ With the above configuration, Flagger will run a canary release with the followi
|
||||
* scale to zero the canary
|
||||
* send notification with the canary analysis result
|
||||
|
||||
The above procedure can be extended with [custom metrics](../usage/metrics.md) checks,
|
||||
[webhooks](../usage/webhooks.md),
|
||||
[manual promotion](../usage/webhooks.md#manual-gating) approval and
|
||||
[Slack or MS Teams](../usage/alerting.md) notifications.
|
||||
The above procedure can be extended with [custom metrics](../usage/metrics.md) checks, [webhooks](../usage/webhooks.md), [manual promotion](../usage/webhooks.md#manual-gating) approval and [Slack or MS Teams](../usage/alerting.md) notifications.
|
||||
|
||||
|
||||
@@ -2,15 +2,13 @@
|
||||
|
||||
This guide shows you how to automate Blue/Green deployments with Flagger and Kubernetes.
|
||||
|
||||
For applications that are not deployed on a service mesh, Flagger can orchestrate Blue/Green style deployments
|
||||
with Kubernetes L4 networking. When using a service mesh blue/green can be used as
|
||||
specified [here](../usage/deployment-strategies.md).
|
||||
For applications that are not deployed on a service mesh, Flagger can orchestrate Blue/Green style deployments with Kubernetes L4 networking. When using a service mesh blue/green can be used as specified [here](../usage/deployment-strategies.md).
|
||||
|
||||
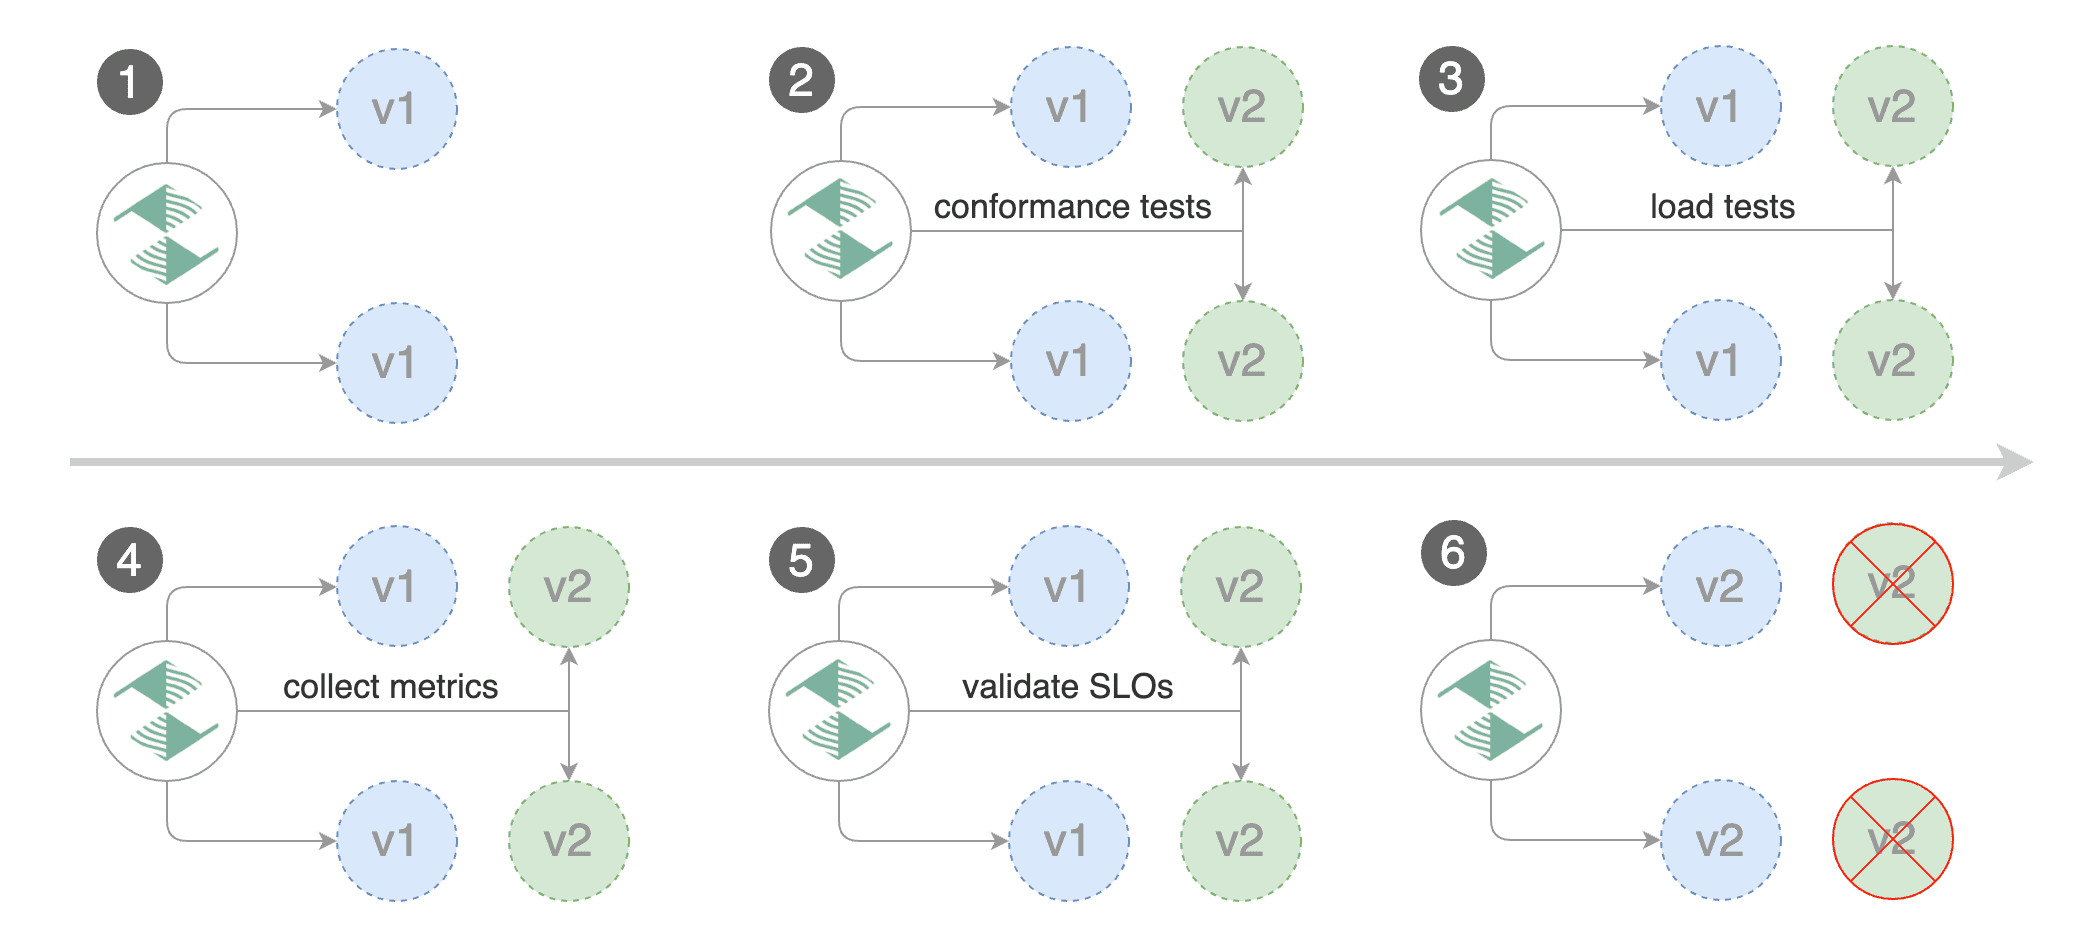
|
||||

|
||||
|
||||
## Prerequisites
|
||||
|
||||
Flagger requires a Kubernetes cluster **v1.11** or newer.
|
||||
Flagger requires a Kubernetes cluster **v1.16** or newer.
|
||||
|
||||
Install Flagger and the Prometheus add-on:
|
||||
|
||||
@@ -44,9 +42,7 @@ helm upgrade -i flagger flagger/flagger \
|
||||
|
||||
## Bootstrap
|
||||
|
||||
Flagger takes a Kubernetes deployment and optionally a horizontal pod autoscaler (HPA),
|
||||
then creates a series of objects (Kubernetes deployment and ClusterIP services).
|
||||
These objects expose the application inside the cluster and drive the canary analysis and Blue/Green promotion.
|
||||
Flagger takes a Kubernetes deployment and optionally a horizontal pod autoscaler \(HPA\), then creates a series of objects \(Kubernetes deployment and ClusterIP services\). These objects expose the application inside the cluster and drive the canary analysis and Blue/Green promotion.
|
||||
|
||||
Create a test namespace:
|
||||
|
||||
@@ -57,13 +53,13 @@ kubectl create ns test
|
||||
Create a deployment and a horizontal pod autoscaler:
|
||||
|
||||
```bash
|
||||
kubectl apply -k github.com/weaveworks/flagger//kustomize/podinfo
|
||||
kubectl apply -k https://github.com/fluxcd/flagger//kustomize/podinfo?ref=main
|
||||
```
|
||||
|
||||
Deploy the load testing service to generate traffic during the analysis:
|
||||
|
||||
```bash
|
||||
kubectl apply -k github.com/weaveworks/flagger//kustomize/tester
|
||||
kubectl apply -k https://github.com/fluxcd/flagger//kustomize/tester?ref=main
|
||||
```
|
||||
|
||||
Create a canary custom resource:
|
||||
@@ -158,10 +154,14 @@ service/podinfo-primary
|
||||
|
||||
Blue/Green scenario:
|
||||
|
||||
* on bootstrap, Flagger will create three ClusterIP services (`app-primary`,`app-canary`, `app`)
|
||||
and a shadow deployment named `app-primary` that represents the blue version
|
||||
* on bootstrap, Flagger will create three ClusterIP services \(`app-primary`,`app-canary`, `app`\)
|
||||
|
||||
and a shadow deployment named `app-primary` that represents the blue version
|
||||
|
||||
* when a new version is detected, Flagger would scale up the green version and run the conformance tests
|
||||
(the tests should target the `app-canary` ClusterIP service to reach the green version)
|
||||
|
||||
\(the tests should target the `app-canary` ClusterIP service to reach the green version\)
|
||||
|
||||
* if the conformance tests are passing, Flagger would start the load tests and validate them with custom Prometheus queries
|
||||
* if the load test analysis is successful, Flagger will promote the new version to `app-primary` and scale down the green version
|
||||
|
||||
@@ -257,9 +257,7 @@ Events:
|
||||
|
||||
## Custom metrics
|
||||
|
||||
The analysis can be extended with Prometheus queries. The demo app is instrumented with Prometheus so you can
|
||||
create a custom check that will use the HTTP request duration histogram to validate the canary (green version).
|
||||
|
||||
The analysis can be extended with Prometheus queries. The demo app is instrumented with Prometheus so you can create a custom check that will use the HTTP request duration histogram to validate the canary \(green version\).
|
||||
|
||||
Create a metric template and apply it on the cluster:
|
||||
|
||||
@@ -307,8 +305,7 @@ Edit the canary analysis and add the following metric:
|
||||
interval: 1m
|
||||
```
|
||||
|
||||
The above configuration validates the canary (green version) by checking if the HTTP 404 req/sec percentage is
|
||||
below 5 percent of the total traffic. If the 404s rate reaches the 5% threshold, then the rollout is rolled back.
|
||||
The above configuration validates the canary \(green version\) by checking if the HTTP 404 req/sec percentage is below 5 percent of the total traffic. If the 404s rate reaches the 5% threshold, then the rollout is rolled back.
|
||||
|
||||
Trigger a deployment by updating the container image:
|
||||
|
||||
@@ -337,8 +334,7 @@ Rolling back podinfo.test failed checks threshold reached 2
|
||||
Canary failed! Scaling down podinfo.test
|
||||
```
|
||||
|
||||
If you have [alerting](../usage/alerting.md) configured,
|
||||
Flagger will send a notification with the reason why the canary failed.
|
||||
If you have [alerting](../usage/alerting.md) configured, Flagger will send a notification with the reason why the canary failed.
|
||||
|
||||
## Conformance Testing with Helm
|
||||
|
||||
@@ -370,8 +366,7 @@ Add a helm test pre-rollout hook to your chart:
|
||||
cmd: "test {{ .Release.Name }} --cleanup"
|
||||
```
|
||||
|
||||
When the canary analysis starts, Flagger will call the pre-rollout webhooks.
|
||||
If the helm test fails, Flagger will retry until the analysis threshold is reached and the canary is rolled back.
|
||||
When the canary analysis starts, Flagger will call the pre-rollout webhooks. If the helm test fails, Flagger will retry until the analysis threshold is reached and the canary is rolled back.
|
||||
|
||||
For an in-depth look at the analysis process read the [usage docs](../usage/how-it-works.md).
|
||||
|
||||
|
||||
@@ -2,20 +2,25 @@
|
||||
|
||||
This guide shows you how to use Linkerd and Flagger to automate canary deployments.
|
||||
|
||||

|
||||

|
||||
|
||||
## Prerequisites
|
||||
|
||||
Flagger requires a Kubernetes cluster **v1.11** or newer and Linkerd **2.4** or newer.
|
||||
Flagger requires a Kubernetes cluster **v1.16** or newer and Linkerd **2.10** or newer.
|
||||
|
||||
Install Linkerd the Promethues (part of Linkerd Viz):
|
||||
|
||||
```bash
|
||||
linkerd install | kubectl apply -f -
|
||||
linkerd viz install | kubectl apply -f -
|
||||
```
|
||||
|
||||
Install Flagger in the linkerd namespace:
|
||||
|
||||
```bash
|
||||
kubectl apply -k github.com/weaveworks/flagger//kustomize/linkerd
|
||||
kubectl apply -k github.com/fluxcd/flagger//kustomize/linkerd
|
||||
```
|
||||
|
||||
Note that you'll need kubectl 1.14 or newer to run the above command.
|
||||
|
||||
## Bootstrap
|
||||
|
||||
Flagger takes a Kubernetes deployment and optionally a horizontal pod autoscaler (HPA),
|
||||
@@ -32,13 +37,13 @@ kubectl annotate namespace test linkerd.io/inject=enabled
|
||||
Install the load testing service to generate traffic during the canary analysis:
|
||||
|
||||
```bash
|
||||
kubectl apply -k github.com/weaveworks/flagger//kustomize/tester
|
||||
kubectl apply -k https://github.com/fluxcd/flagger//kustomize/tester?ref=main
|
||||
```
|
||||
|
||||
Create a deployment and a horizontal pod autoscaler:
|
||||
|
||||
```bash
|
||||
kubectl apply -k github.com/weaveworks/flagger//kustomize/podinfo
|
||||
kubectl apply -k https://github.com/fluxcd/flagger//kustomize/podinfo?ref=main
|
||||
```
|
||||
|
||||
Create a canary custom resource for the podinfo deployment:
|
||||
@@ -115,8 +120,7 @@ Save the above resource as podinfo-canary.yaml and then apply it:
|
||||
kubectl apply -f ./podinfo-canary.yaml
|
||||
```
|
||||
|
||||
When the canary analysis starts, Flagger will call the pre-rollout webhooks before routing traffic to the canary.
|
||||
The canary analysis will run for five minutes while validating the HTTP metrics and rollout hooks every half a minute.
|
||||
When the canary analysis starts, Flagger will call the pre-rollout webhooks before routing traffic to the canary. The canary analysis will run for five minutes while validating the HTTP metrics and rollout hooks every half a minute.
|
||||
|
||||
After a couple of seconds Flagger will create the canary objects:
|
||||
|
||||
@@ -136,17 +140,13 @@ service/podinfo-primary
|
||||
trafficsplits.split.smi-spec.io/podinfo
|
||||
```
|
||||
|
||||
After the boostrap, the podinfo deployment will be scaled to zero and the traffic to `podinfo.test`
|
||||
will be routed to the primary pods.
|
||||
During the canary analysis, the `podinfo-canary.test` address can be used to target directly the canary pods.
|
||||
After the boostrap, the podinfo deployment will be scaled to zero and the traffic to `podinfo.test` will be routed to the primary pods. During the canary analysis, the `podinfo-canary.test` address can be used to target directly the canary pods.
|
||||
|
||||
## Automated canary promotion
|
||||
|
||||
Flagger implements a control loop that gradually shifts traffic to the canary while measuring
|
||||
key performance indicators like HTTP requests success rate, requests average duration and pod health.
|
||||
Based on analysis of the KPIs a canary is promoted or aborted, and the analysis result is published to Slack.
|
||||
Flagger implements a control loop that gradually shifts traffic to the canary while measuring key performance indicators like HTTP requests success rate, requests average duration and pod health. Based on analysis of the KPIs a canary is promoted or aborted, and the analysis result is published to Slack.
|
||||
|
||||

|
||||

|
||||
|
||||
Trigger a canary deployment by updating the container image:
|
||||
|
||||
@@ -205,8 +205,7 @@ prod backend Failed 0 2019-06-30T17:05:07Z
|
||||
|
||||
## Automated rollback
|
||||
|
||||
During the canary analysis you can generate HTTP 500 errors and high latency to
|
||||
test if Flagger pauses and rolls back the faulted version.
|
||||
During the canary analysis you can generate HTTP 500 errors and high latency to test if Flagger pauses and rolls back the faulted version.
|
||||
|
||||
Trigger another canary deployment:
|
||||
|
||||
@@ -233,8 +232,7 @@ Generate latency:
|
||||
watch -n 1 curl http://podinfo-canary.test:9898/delay/1
|
||||
```
|
||||
|
||||
When the number of failed checks reaches the canary analysis threshold, the traffic is routed back to the primary,
|
||||
the canary is scaled to zero and the rollout is marked as failed.
|
||||
When the number of failed checks reaches the canary analysis threshold, the traffic is routed back to the primary, the canary is scaled to zero and the rollout is marked as failed.
|
||||
|
||||
```text
|
||||
kubectl -n test describe canary/podinfo
|
||||
@@ -293,9 +291,7 @@ Let's a define a check for not found errors. Edit the canary analysis and add th
|
||||
* 100
|
||||
```
|
||||
|
||||
The above configuration validates the canary version by checking if the HTTP 404 req/sec percentage
|
||||
is below three percent of the total traffic.
|
||||
If the 404s rate reaches the 3% threshold, then the analysis is aborted and the canary is marked as failed.
|
||||
The above configuration validates the canary version by checking if the HTTP 404 req/sec percentage is below three percent of the total traffic. If the 404s rate reaches the 3% threshold, then the analysis is aborted and the canary is marked as failed.
|
||||
|
||||
Trigger a canary deployment by updating the container image:
|
||||
|
||||
@@ -340,8 +336,7 @@ helm upgrade -i nginx-ingress stable/nginx-ingress \
|
||||
--namespace ingress-nginx
|
||||
```
|
||||
|
||||
Create an ingress definition for podinfo that rewrites the incoming header
|
||||
to the internal service name (required by Linkerd):
|
||||
Create an ingress definition for podinfo that rewrites the incoming header to the internal service name \(required by Linkerd\):
|
||||
|
||||
```yaml
|
||||
apiVersion: extensions/v1beta1
|
||||
@@ -367,20 +362,15 @@ spec:
|
||||
servicePort: 9898
|
||||
```
|
||||
|
||||
When using an ingress controller, the Linkerd traffic split does not apply to incoming traffic
|
||||
since NGINX in running outside of the mesh. In order to run a canary analysis for a frontend app,
|
||||
Flagger creates a shadow ingress and sets the NGINX specific annotations.
|
||||
When using an ingress controller, the Linkerd traffic split does not apply to incoming traffic since NGINX in running outside of the mesh. In order to run a canary analysis for a frontend app, Flagger creates a shadow ingress and sets the NGINX specific annotations.
|
||||
|
||||
## A/B Testing
|
||||
|
||||
Besides weighted routing, Flagger can be configured to route traffic to the canary based on HTTP match conditions.
|
||||
In an A/B testing scenario, you'll be using HTTP headers or cookies to target a certain segment of your users.
|
||||
This is particularly useful for frontend applications that require session affinity.
|
||||
Besides weighted routing, Flagger can be configured to route traffic to the canary based on HTTP match conditions. In an A/B testing scenario, you'll be using HTTP headers or cookies to target a certain segment of your users. This is particularly useful for frontend applications that require session affinity.
|
||||
|
||||
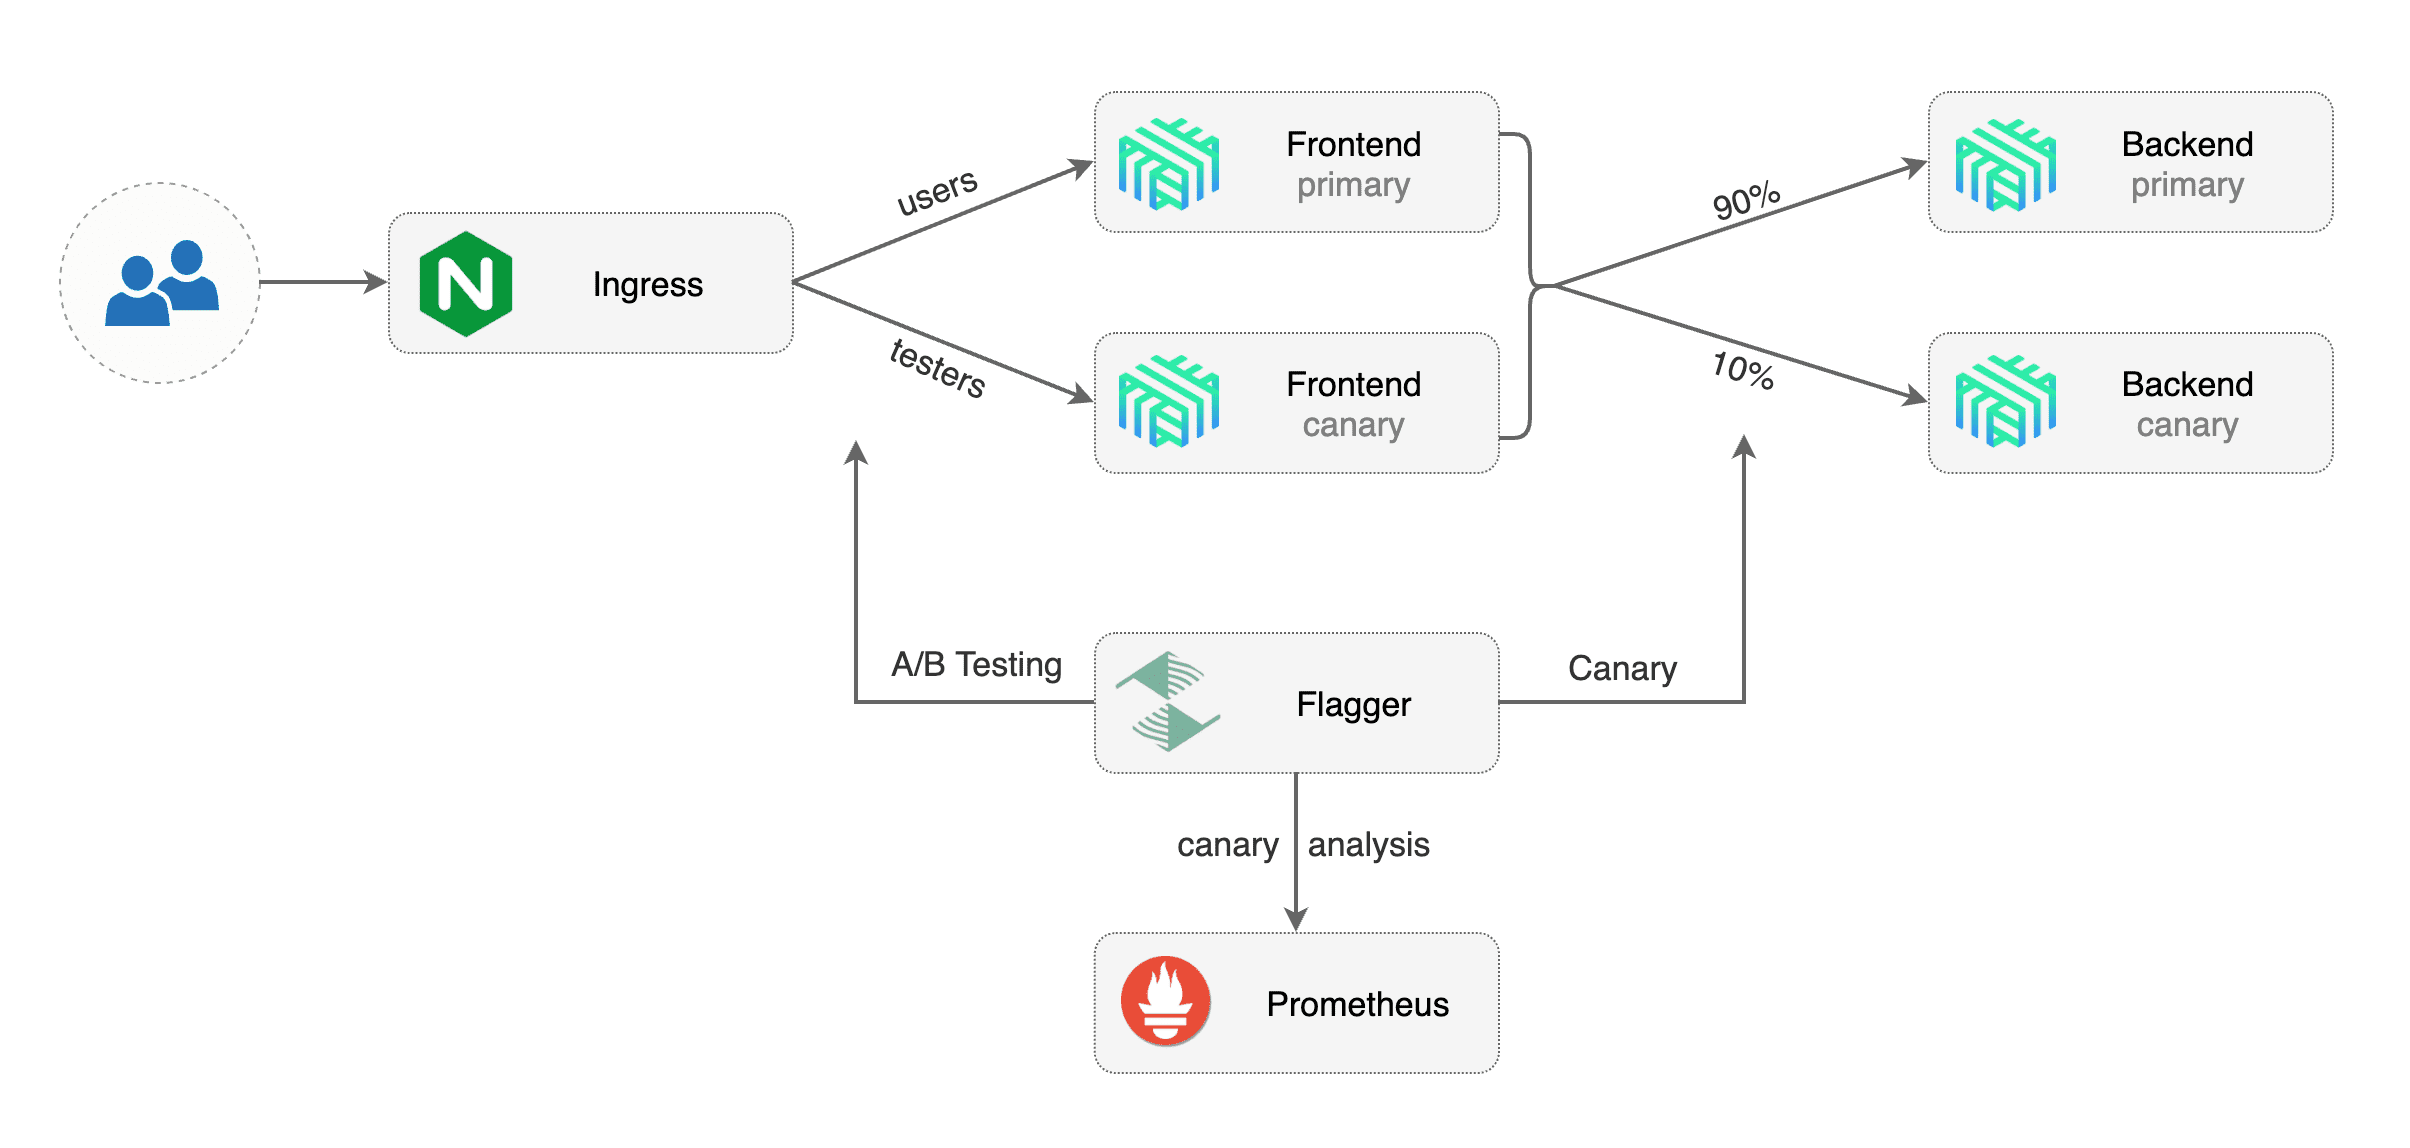
|
||||

|
||||
|
||||
Edit podinfo canary analysis, set the provider to `nginx`, add the ingress reference,
|
||||
remove the max/step weight and add the match conditions and iterations:
|
||||
Edit podinfo canary analysis, set the provider to `nginx`, add the ingress reference, remove the max/step weight and add the match conditions and iterations:
|
||||
|
||||
```yaml
|
||||
apiVersion: flagger.app/v1beta1
|
||||
@@ -444,8 +434,7 @@ spec:
|
||||
cmd: "hey -z 2m -q 10 -c 2 -H 'Cookie: canary=always' http://app.example.com"
|
||||
```
|
||||
|
||||
The above configuration will run an analysis for ten minutes targeting users that have
|
||||
a `canary` cookie set to `always` or those that call the service using the `X-Canary: always` header.
|
||||
The above configuration will run an analysis for ten minutes targeting users that have a `canary` cookie set to `always` or those that call the service using the `X-Canary: always` header.
|
||||
|
||||
**Note** that the load test now targets the external address and uses the canary cookie.
|
||||
|
||||
@@ -479,7 +468,5 @@ Events:
|
||||
Promotion completed! Scaling down podinfo.test
|
||||
```
|
||||
|
||||
The above procedure can be extended with [custom metrics](../usage/metrics.md) checks,
|
||||
[webhooks](../usage/webhooks.md),
|
||||
[manual promotion](../usage/webhooks.md#manual-gating) approval and
|
||||
[Slack or MS Teams](../usage/alerting.md) notifications.
|
||||
The above procedure can be extended with [custom metrics](../usage/metrics.md) checks, [webhooks](../usage/webhooks.md), [manual promotion](../usage/webhooks.md#manual-gating) approval and [Slack or MS Teams](../usage/alerting.md) notifications.
|
||||
|
||||
|
||||
@@ -2,24 +2,25 @@
|
||||
|
||||
This guide shows you how to use the NGINX ingress controller and Flagger to automate canary deployments and A/B testing.
|
||||
|
||||

|
||||
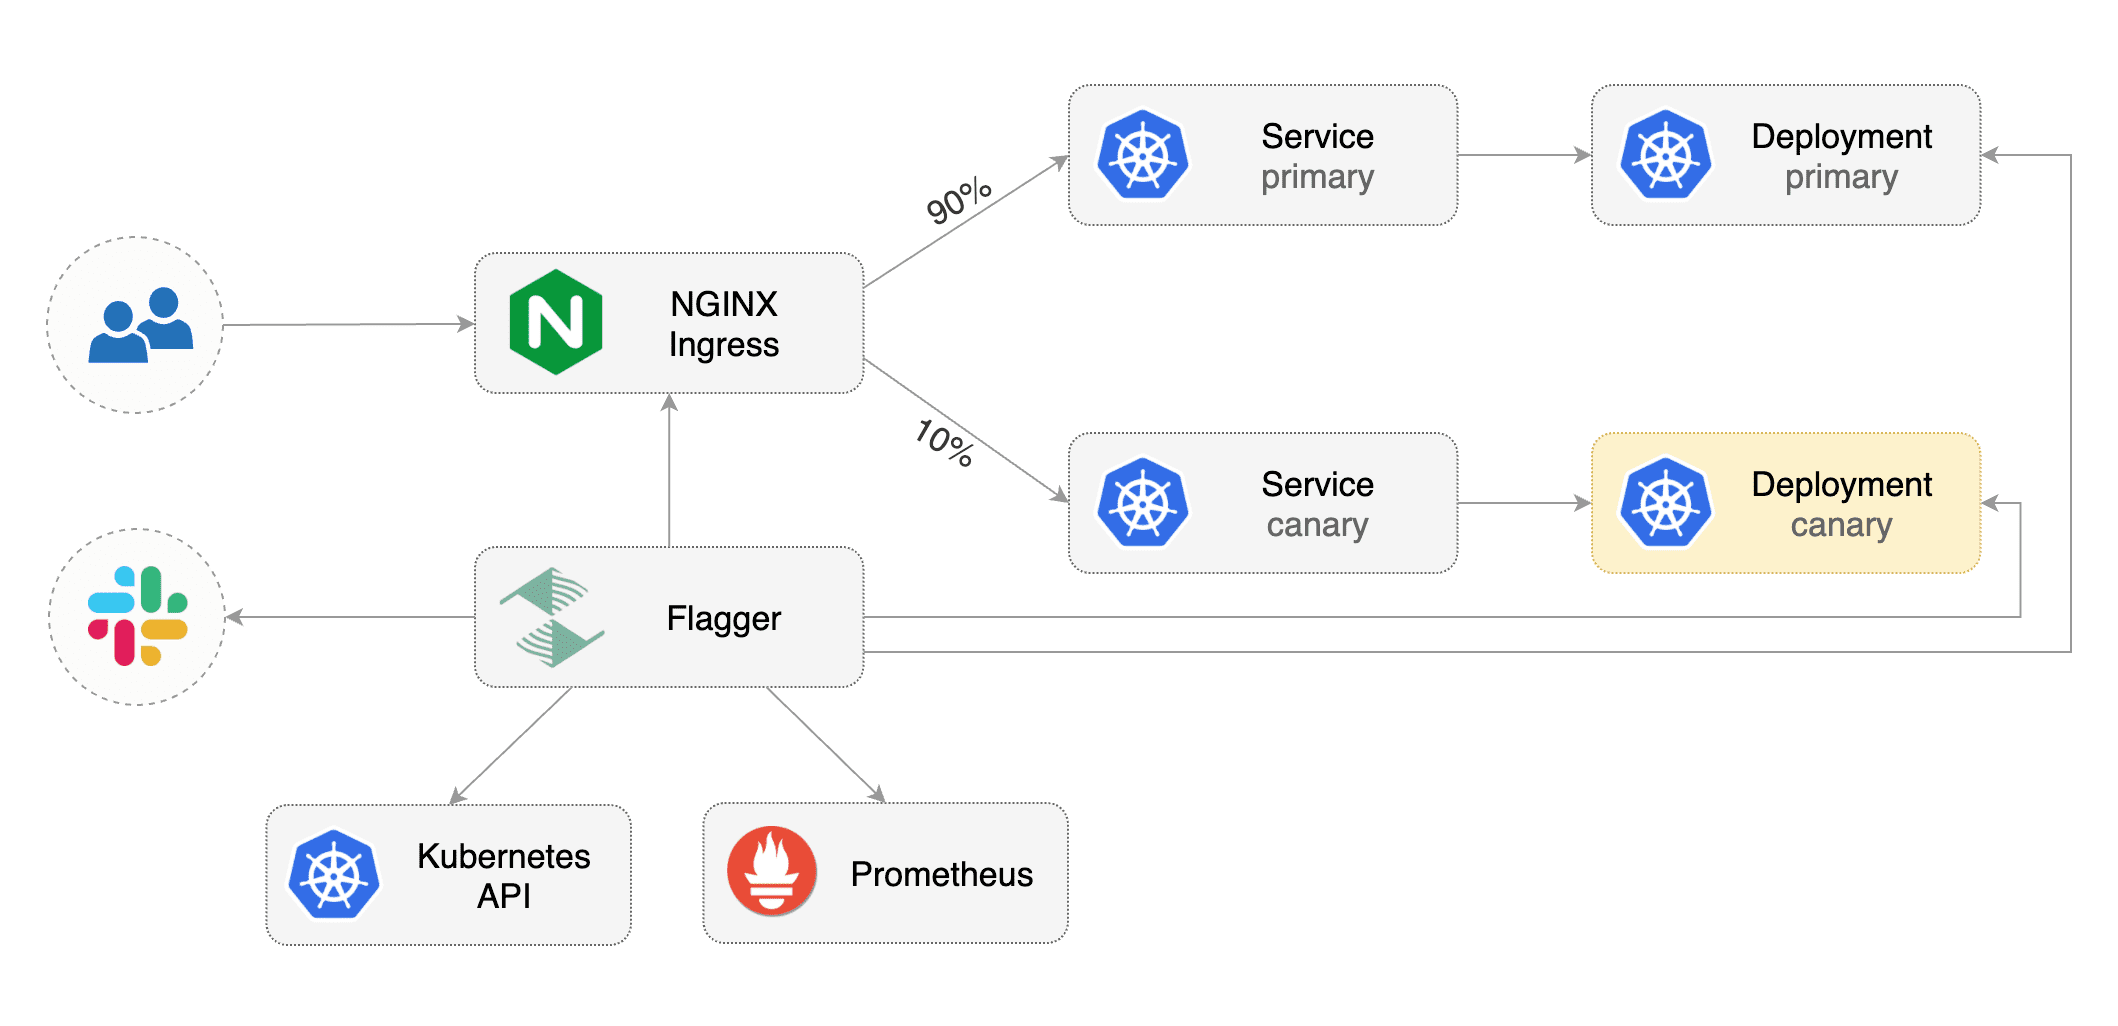
|
||||
|
||||
## Prerequisites
|
||||
|
||||
Flagger requires a Kubernetes cluster **v1.14** or newer and NGINX ingress **0.24** or newer.
|
||||
Flagger requires a Kubernetes cluster **v1.16** or newer and NGINX ingress **v0.41** or newer.
|
||||
|
||||
Install NGINX with Helm v3:
|
||||
Install the NGINX ingress controller with Helm v3:
|
||||
|
||||
```bash
|
||||
helm repo add ingress-nginx https://kubernetes.github.io/ingress-nginx
|
||||
kubectl create ns ingress-nginx
|
||||
helm upgrade -i nginx-ingress stable/nginx-ingress \
|
||||
helm upgrade -i ingress-nginx ingress-nginx/ingress-nginx \
|
||||
--namespace ingress-nginx \
|
||||
--set controller.metrics.enabled=true \
|
||||
--set controller.podAnnotations."prometheus\.io/scrape"=true \
|
||||
--set controller.podAnnotations."prometheus\.io/port"=10254
|
||||
```
|
||||
|
||||
Install Flagger and the Prometheus add-on in the same namespace as NGINX:
|
||||
Install Flagger and the Prometheus add-on in the same namespace as the ingress controller:
|
||||
|
||||
```bash
|
||||
helm repo add flagger https://flagger.app
|
||||
@@ -30,17 +31,6 @@ helm upgrade -i flagger flagger/flagger \
|
||||
--set meshProvider=nginx
|
||||
```
|
||||
|
||||
Optionally you can enable Slack notifications:
|
||||
|
||||
```bash
|
||||
helm upgrade -i flagger flagger/flagger \
|
||||
--reuse-values \
|
||||
--namespace ingress-nginx \
|
||||
--set slack.url=https://hooks.slack.com/services/YOUR/SLACK/WEBHOOK \
|
||||
--set slack.channel=general \
|
||||
--set slack.user=flagger
|
||||
```
|
||||
|
||||
## Bootstrap
|
||||
|
||||
Flagger takes a Kubernetes deployment and optionally a horizontal pod autoscaler (HPA),
|
||||
@@ -56,7 +46,7 @@ kubectl create ns test
|
||||
Create a deployment and a horizontal pod autoscaler:
|
||||
|
||||
```bash
|
||||
kubectl apply -k github.com/weaveworks/flagger//kustomize/podinfo
|
||||
kubectl apply -k https://github.com/fluxcd/flagger//kustomize/podinfo?ref=main
|
||||
```
|
||||
|
||||
Deploy the load testing service to generate traffic during the canary analysis:
|
||||
@@ -66,7 +56,7 @@ helm upgrade -i flagger-loadtester flagger/loadtester \
|
||||
--namespace=test
|
||||
```
|
||||
|
||||
Create an ingress definition \(replace `app.example.com` with your own domain\):
|
||||
Create an ingress definition (replace `app.example.com` with your own domain):
|
||||
|
||||
```yaml
|
||||
apiVersion: networking.k8s.io/v1beta1
|
||||
@@ -94,7 +84,7 @@ Save the above resource as podinfo-ingress.yaml and then apply it:
|
||||
kubectl apply -f ./podinfo-ingress.yaml
|
||||
```
|
||||
|
||||
Create a canary custom resource \(replace `app.example.com` with your own domain\):
|
||||
Create a canary custom resource (replace `app.example.com` with your own domain):
|
||||
|
||||
```yaml
|
||||
apiVersion: flagger.app/v1beta1
|
||||
@@ -188,11 +178,11 @@ ingresses.extensions/podinfo-canary
|
||||
|
||||
## Automated canary promotion
|
||||
|
||||
Flagger implements a control loop that gradually shifts traffic to the canary while measuring
|
||||
key performance indicators like HTTP requests success rate, requests average duration and pod health.
|
||||
Flagger implements a control loop that gradually shifts traffic to the canary while measuring key performance
|
||||
indicators like HTTP requests success rate, requests average duration and pod health.
|
||||
Based on analysis of the KPIs a canary is promoted or aborted, and the analysis result is published to Slack or MS Teams.
|
||||
|
||||

|
||||

|
||||
|
||||
Trigger a canary deployment by updating the container image:
|
||||
|
||||
@@ -261,7 +251,8 @@ Generate HTTP 500 errors:
|
||||
watch curl http://app.example.com/status/500
|
||||
```
|
||||
|
||||
When the number of failed checks reaches the canary analysis threshold, the traffic is routed back to the primary,
|
||||
When the number of failed checks reaches the canary analysis threshold,
|
||||
the traffic is routed back to the primary,
|
||||
the canary is scaled to zero and the rollout is marked as failed.
|
||||
|
||||
```text
|
||||
@@ -291,8 +282,8 @@ Events:
|
||||
|
||||
The canary analysis can be extended with Prometheus queries.
|
||||
|
||||
The demo app is instrumented with Prometheus so you can create a custom check that will use the
|
||||
HTTP request duration histogram to validate the canary.
|
||||
The demo app is instrumented with Prometheus so you can create a custom check
|
||||
that will use the HTTP request duration histogram to validate the canary.
|
||||
|
||||
Create a metric template and apply it on the cluster:
|
||||
|
||||
@@ -332,8 +323,8 @@ Edit the canary analysis and add the latency check:
|
||||
interval: 1m
|
||||
```
|
||||
|
||||
The threshold is set to 500ms so if the average request duration in the last minute goes over half a second
|
||||
then the analysis will fail and the canary will not be promoted.
|
||||
The threshold is set to 500ms so if the average request duration in the last minute goes over
|
||||
half a second then the analysis will fail and the canary will not be promoted.
|
||||
|
||||
Trigger a canary deployment by updating the container image:
|
||||
|
||||
@@ -374,7 +365,7 @@ Besides weighted routing, Flagger can be configured to route traffic to the cana
|
||||
In an A/B testing scenario, you'll be using HTTP headers or cookies to target a certain segment of your users.
|
||||
This is particularly useful for frontend applications that require session affinity.
|
||||
|
||||

|
||||

|
||||
|
||||
Edit the canary analysis, remove the max/step weight and add the match conditions and iterations:
|
||||
|
||||
@@ -405,8 +396,8 @@ Edit the canary analysis, remove the max/step weight and add the match condition
|
||||
cmd: "hey -z 1m -q 10 -c 2 -H 'Cookie: canary=always' http://app.example.com/"
|
||||
```
|
||||
|
||||
The above configuration will run an analysis for ten minutes targeting users that have a `canary` cookie
|
||||
set to `always` or those that call the service using the `X-Canary: insider` header.
|
||||
The above configuration will run an analysis for ten minutes targeting users that have
|
||||
a `canary` cookie set to `always` or those that call the service using the `X-Canary: insider` header.
|
||||
|
||||
Trigger a canary deployment by updating the container image:
|
||||
|
||||
@@ -444,7 +435,8 @@ Events:
|
||||
Normal Synced 5s flagger Promotion completed! Scaling down podinfo.test
|
||||
```
|
||||
|
||||
The above procedure can be extended with [custom metrics](../usage/metrics.md) checks,
|
||||
The above procedure can be extended with
|
||||
[custom metrics](../usage/metrics.md) checks,
|
||||
[webhooks](../usage/webhooks.md),
|
||||
[manual promotion](../usage/webhooks.md#manual-gating) approval and
|
||||
[Slack or MS Teams](../usage/alerting.md) notifications.
|
||||
|
||||
@@ -1,23 +1,26 @@
|
||||
# Canary analysis with Prometheus Operator
|
||||
|
||||
This guide show you how to use Prometheus Operator for canary analysis.
|
||||
This guide show you how to use
|
||||
[Prometheus Operator](https://github.com/prometheus-operator/prometheus-operator) for canary analysis.
|
||||
|
||||
## Prerequisites
|
||||
|
||||
Flagger requires a Kubernetes cluster **v1.16** or newer and Prometheus Operator **v0.40** or newer.
|
||||
|
||||
Install Prometheus Operator with Helm v3:
|
||||
|
||||
```bash
|
||||
helm repo add stable https://kubernetes-charts.storage.googleapis.com
|
||||
helm repo add prometheus-community https://prometheus-community.github.io/helm-charts
|
||||
|
||||
kubectl create ns monitoring
|
||||
helm upgrade -i prometheus stable/prometheus-operator \
|
||||
helm upgrade -i prometheus prometheus-community/kube-prometheus-stack \
|
||||
--namespace monitoring \
|
||||
--set prometheus.prometheusSpec.serviceMonitorSelectorNilUsesHelmValues=false \
|
||||
--set fullnameOverride=prometheus
|
||||
```
|
||||
|
||||
The `prometheus.prometheusSpec.serviceMonitorSelectorNilUsesHelmValues=false`
|
||||
option allows Prometheus operator to watch serviceMonitors outside of his namespace.
|
||||
option allows Prometheus Operator to watch serviceMonitors outside of its namespace.
|
||||
|
||||
Install Flagger by setting the metrics server to Prometheus:
|
||||
|
||||
@@ -38,7 +41,7 @@ helm upgrade -i loadtester flagger/loadtester \
|
||||
--namespace flagger-system
|
||||
```
|
||||
|
||||
Install podinfo demo app:
|
||||
Install [podinfo](https://github.com/stefanprodan/podinfo) demo app:
|
||||
|
||||
```bash
|
||||
helm repo add podinfo https://stefanprodan.github.io/podinfo
|
||||
@@ -51,23 +54,8 @@ helm upgrade -i podinfo podinfo/podinfo \
|
||||
|
||||
## Service monitors
|
||||
|
||||
The demo app is instrumented with Prometheus so you can create service monitors to scrape podinfo's metrics endpoint:
|
||||
|
||||
```yaml
|
||||
apiVersion: monitoring.coreos.com/v1
|
||||
kind: ServiceMonitor
|
||||
metadata:
|
||||
name: podinfo-primary
|
||||
namespace: test
|
||||
spec:
|
||||
endpoints:
|
||||
- path: /metrics
|
||||
port: http
|
||||
interval: 5s
|
||||
selector:
|
||||
matchLabels:
|
||||
app: podinfo
|
||||
```
|
||||
The demo app is instrumented with Prometheus,
|
||||
so you can create a `ServiceMonitor` objects to scrape podinfo's metrics endpoint:
|
||||
|
||||
```yaml
|
||||
apiVersion: monitoring.coreos.com/v1
|
||||
@@ -83,10 +71,24 @@ spec:
|
||||
selector:
|
||||
matchLabels:
|
||||
app: podinfo-canary
|
||||
---
|
||||
apiVersion: monitoring.coreos.com/v1
|
||||
kind: ServiceMonitor
|
||||
metadata:
|
||||
name: podinfo-primary
|
||||
namespace: test
|
||||
spec:
|
||||
endpoints:
|
||||
- path: /metrics
|
||||
port: http
|
||||
interval: 5s
|
||||
selector:
|
||||
matchLabels:
|
||||
app: podinfo
|
||||
```
|
||||
|
||||
We are setting `interval: 5s` to have a more aggressive scraping.
|
||||
If you do not define it, you must to use a longer interval in the Canary object.
|
||||
If you do not define it, you should use a longer interval in the Canary object.
|
||||
|
||||
## Metric templates
|
||||
|
||||
@@ -191,7 +193,7 @@ spec:
|
||||
cmd: "hey -z 1m -q 10 -c 2 http://podinfo-canary.test/"
|
||||
```
|
||||
|
||||
Based on the above specification, Flagger creates the primary and canary Kubernetes ClusterIP service.
|
||||
Based on the above specification, Flagger creates the primary and canary Kubernetes ClusterIP service.
|
||||
|
||||
During the canary analysis, Prometheus will scrape the canary service and Flagger will use the HTTP error rate and
|
||||
latency queries to determine if the release should be promoted or rolled back.
|
||||
During the canary analysis, Prometheus will scrape the canary service and Flagger will use the HTTP error rate
|
||||
and latency queries to determine if the release should be promoted or rolled back.
|
||||
|
||||
@@ -2,11 +2,11 @@
|
||||
|
||||
This guide shows you how to use the [Skipper ingress controller](https://opensource.zalando.com/skipper/kubernetes/ingress-controller/) and Flagger to automate canary deployments.
|
||||
|
||||

|
||||
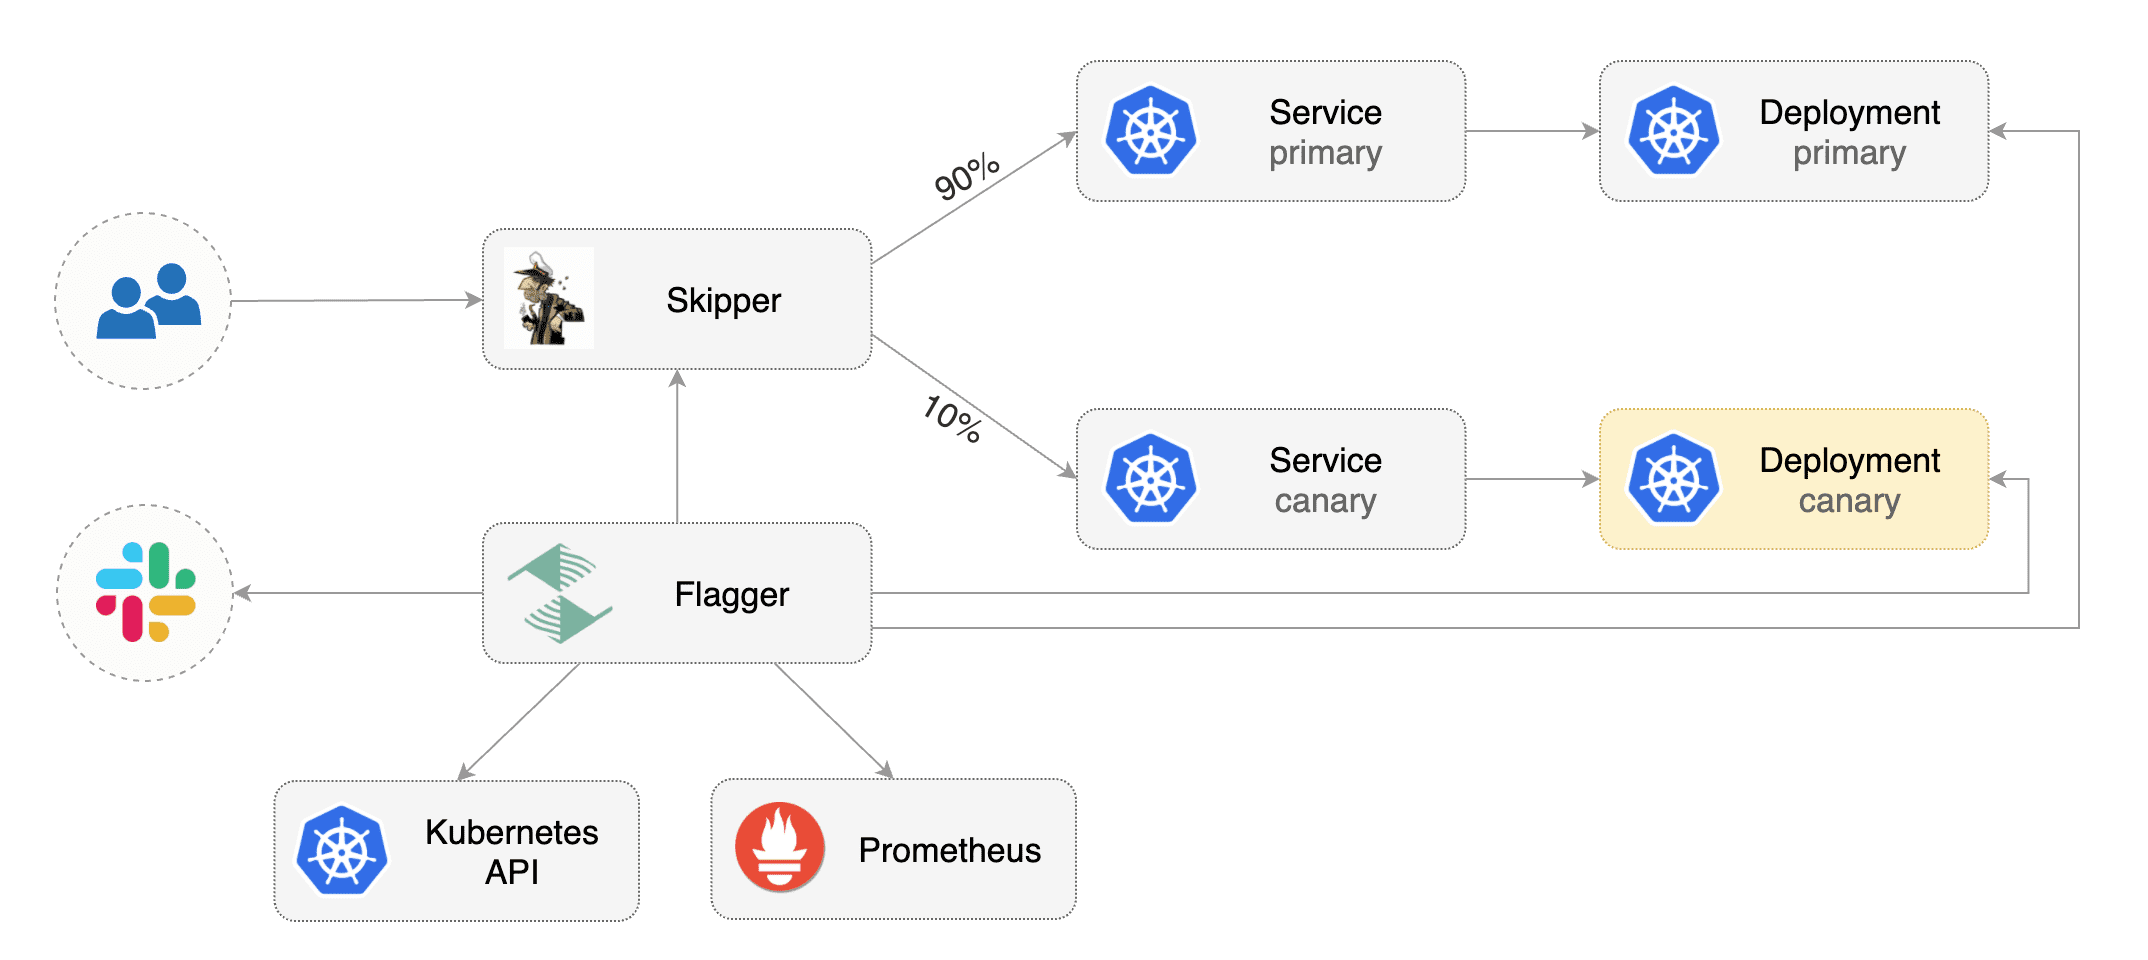
|
||||
|
||||
## Prerequisites
|
||||
|
||||
Flagger requires a Kubernetes cluster **v1.14** or newer and Skipper ingress **0.11.40** or newer.
|
||||
Flagger requires a Kubernetes cluster **v1.16** or newer and Skipper ingress **0.11.40** or newer.
|
||||
|
||||
Install Skipper ingress-controller using [upstream definition](https://opensource.zalando.com/skipper/kubernetes/ingress-controller/#install-skipper-as-ingress-controller).
|
||||
|
||||
@@ -31,14 +31,12 @@ Certain arguments are relevant:
|
||||
Install Flagger using kustomize:
|
||||
|
||||
```bash
|
||||
kustomize build https://github.com/weaveworks/flagger/kustomize/kubernetes | kubectl apply -f -
|
||||
kustomize build https://github.com/fluxcd/flagger/kustomize/kubernetes | kubectl apply -f -
|
||||
```
|
||||
|
||||
## Bootstrap
|
||||
|
||||
Flagger takes a Kubernetes deployment and optionally a horizontal pod autoscaler (HPA),
|
||||
then creates a series of objects (Kubernetes deployments, ClusterIP services and canary ingress).
|
||||
These objects expose the application outside the cluster and drive the canary analysis and promotion.
|
||||
Flagger takes a Kubernetes deployment and optionally a horizontal pod autoscaler \(HPA\), then creates a series of objects \(Kubernetes deployments, ClusterIP services and canary ingress\). These objects expose the application outside the cluster and drive the canary analysis and promotion.
|
||||
|
||||
Create a test namespace:
|
||||
|
||||
@@ -49,7 +47,7 @@ kubectl create ns test
|
||||
Create a deployment and a horizontal pod autoscaler:
|
||||
|
||||
```bash
|
||||
kubectl apply -k github.com/weaveworks/flagger//kustomize/podinfo
|
||||
kubectl apply -k https://github.com/fluxcd/flagger//kustomize/podinfo?ref=main
|
||||
```
|
||||
|
||||
Deploy the load testing service to generate traffic during the canary analysis:
|
||||
@@ -192,11 +190,9 @@ ingress.networking.k8s.io/podinfo-canary
|
||||
|
||||
## Automated canary promotion
|
||||
|
||||
Flagger implements a control loop that gradually shifts traffic to the canary while measuring
|
||||
key performance indicators like HTTP requests success rate, requests average duration and pod health.
|
||||
Based on analysis of the KPIs a canary is promoted or aborted, and the analysis result is published to Slack or MS Teams.
|
||||
Flagger implements a control loop that gradually shifts traffic to the canary while measuring key performance indicators like HTTP requests success rate, requests average duration and pod health. Based on analysis of the KPIs a canary is promoted or aborted, and the analysis result is published to Slack or MS Teams.
|
||||
|
||||

|
||||

|
||||
|
||||
Trigger a canary deployment by updating the container image:
|
||||
|
||||
@@ -275,8 +271,7 @@ Generate latency:
|
||||
watch -n 1 curl http://app.example.com/delay/1
|
||||
```
|
||||
|
||||
When the number of failed checks reaches the canary analysis threshold, the traffic is routed back to the primary,
|
||||
the canary is scaled to zero and the rollout is marked as failed.
|
||||
When the number of failed checks reaches the canary analysis threshold, the traffic is routed back to the primary, the canary is scaled to zero and the rollout is marked as failed.
|
||||
|
||||
```text
|
||||
kubectl -n flagger-system logs deploy/flagger -f | jq .msg
|
||||
@@ -338,8 +333,7 @@ Edit the canary analysis and add the latency check:
|
||||
interval: 1m
|
||||
```
|
||||
|
||||
The threshold is set to 500ms so if the average request duration in the last minute goes over half a second
|
||||
then the analysis will fail and the canary will not be promoted.
|
||||
The threshold is set to 500ms so if the average request duration in the last minute goes over half a second then the analysis will fail and the canary will not be promoted.
|
||||
|
||||
Trigger a canary deployment by updating the container image:
|
||||
|
||||
@@ -373,3 +367,4 @@ Canary failed! Scaling down podinfo.test
|
||||
```
|
||||
|
||||
If you have alerting configured, Flagger will send a notification with the reason why the canary failed.
|
||||
|
||||
|
||||
@@ -2,9 +2,11 @@
|
||||
|
||||
This guide shows you how to use the [Traefik](https://doc.traefik.io/traefik/) and Flagger to automate canary deployments.
|
||||
|
||||
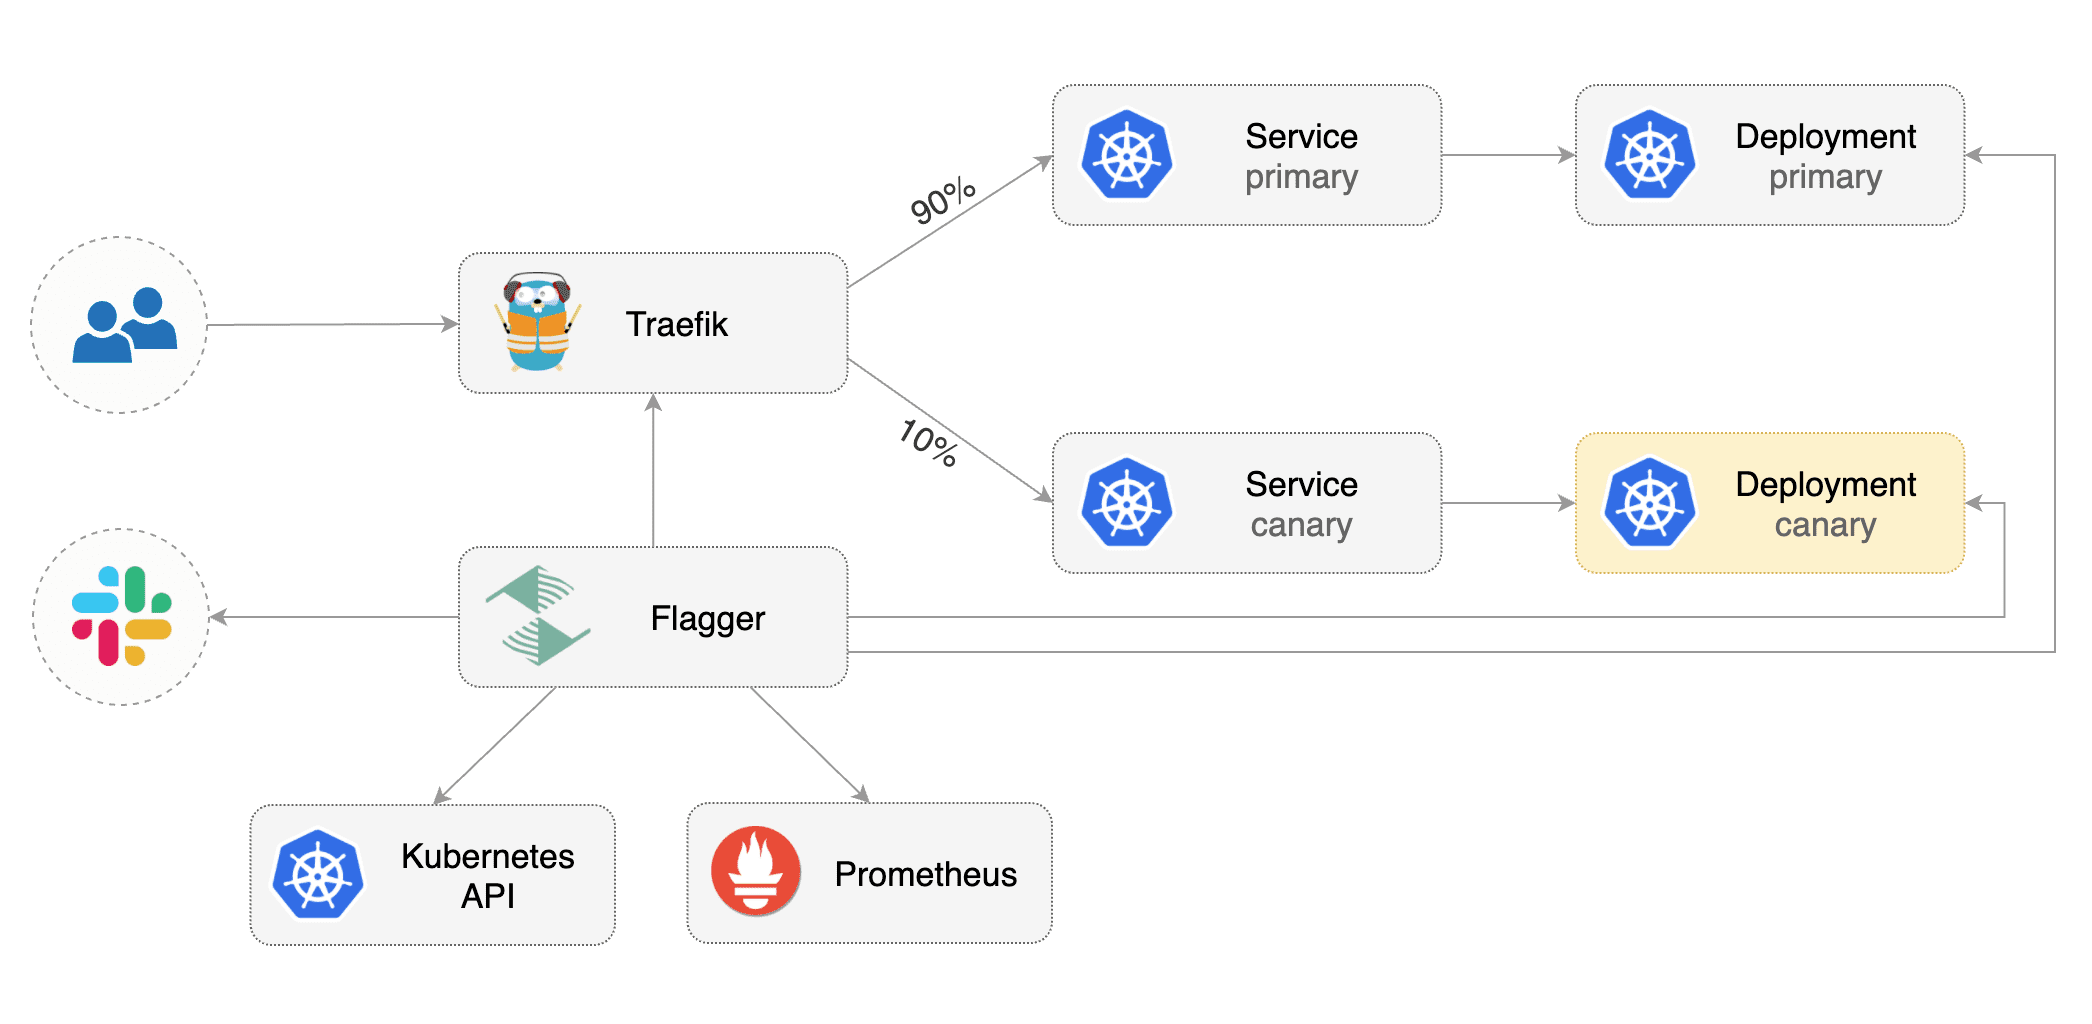
|
||||
|
||||
## Prerequisites
|
||||
|
||||
Flagger requires a Kubernetes cluster **v1.14** or newer and Traefik **v2.3** or newer.
|
||||
Flagger requires a Kubernetes cluster **v1.16** or newer and Traefik **v2.3** or newer.
|
||||
|
||||
Install Traefik with Helm v3:
|
||||
|
||||
@@ -13,7 +15,7 @@ helm repo add traefik https://helm.traefik.io/traefik
|
||||
kubectl create ns traefik
|
||||
helm upgrade -i traefik traefik/traefik \
|
||||
--namespace traefik \
|
||||
--set additionalArguments="--metrics.prometheus=true"
|
||||
--set additionalArguments="{--metrics.prometheus=true}"
|
||||
```
|
||||
|
||||
Install Flagger and the Prometheus add-on in the same namespace as Traefik:
|
||||
@@ -29,9 +31,7 @@ helm upgrade -i flagger flagger/flagger \
|
||||
|
||||
## Bootstrap
|
||||
|
||||
Flagger takes a Kubernetes deployment and optionally a horizontal pod autoscaler (HPA),
|
||||
then creates a series of objects (Kubernetes deployments, ClusterIP services and TraefikService).
|
||||
These objects expose the application outside the cluster and drive the canary analysis and promotion.
|
||||
Flagger takes a Kubernetes deployment and optionally a horizontal pod autoscaler \(HPA\), then creates a series of objects \(Kubernetes deployments, ClusterIP services and TraefikService\). These objects expose the application outside the cluster and drive the canary analysis and promotion.
|
||||
|
||||
Create a test namespace:
|
||||
|
||||
@@ -42,7 +42,7 @@ kubectl create ns test
|
||||
Create a deployment and a horizontal pod autoscaler:
|
||||
|
||||
```bash
|
||||
kubectl apply -k github.com/weaveworks/flagger//kustomize/podinfo
|
||||
kubectl apply -k https://github.com/fluxcd/flagger//kustomize/podinfo?ref=main
|
||||
```
|
||||
|
||||
Deploy the load testing service to generate traffic during the canary analysis:
|
||||
@@ -52,8 +52,7 @@ helm upgrade -i flagger-loadtester flagger/loadtester \
|
||||
--namespace=test
|
||||
```
|
||||
|
||||
Create Traefik IngressRoute that references TraefikService generated by Flagger
|
||||
(replace `app.example.com` with your own domain):
|
||||
Create Traefik IngressRoute that references TraefikService generated by Flagger \(replace `app.example.com` with your own domain\):
|
||||
|
||||
```yaml
|
||||
apiVersion: traefik.containo.us/v1alpha1
|
||||
@@ -79,7 +78,7 @@ Save the above resource as podinfo-ingressroute.yaml and then apply it:
|
||||
kubectl apply -f ./podinfo-ingressroute.yaml
|
||||
```
|
||||
|
||||
Create a canary custom resource (replace `app.example.com` with your own domain):
|
||||
Create a canary custom resource \(replace `app.example.com` with your own domain\):
|
||||
|
||||
```yaml
|
||||
apiVersion: flagger.app/v1beta1
|
||||
@@ -175,11 +174,9 @@ traefikservice.traefik.containo.us/podinfo
|
||||
|
||||
## Automated canary promotion
|
||||
|
||||
Flagger implements a control loop that gradually shifts traffic to the canary while measuring
|
||||
key performance indicators like HTTP requests success rate, requests average duration and pod health.
|
||||
Based on analysis of the KPIs a canary is promoted or aborted, and the analysis result is published to Slack or MS Teams.
|
||||
Flagger implements a control loop that gradually shifts traffic to the canary while measuring key performance indicators like HTTP requests success rate, requests average duration and pod health. Based on analysis of the KPIs a canary is promoted or aborted, and the analysis result is published to Slack or MS Teams.
|
||||
|
||||

|
||||

|
||||
|
||||
Trigger a canary deployment by updating the container image:
|
||||
|
||||
@@ -258,8 +255,7 @@ Generate latency:
|
||||
watch -n 1 curl http://app.example.com/delay/1
|
||||
```
|
||||
|
||||
When the number of failed checks reaches the canary analysis threshold, the traffic is routed back to the primary,
|
||||
the canary is scaled to zero and the rollout is marked as failed.
|
||||
When the number of failed checks reaches the canary analysis threshold, the traffic is routed back to the primary, the canary is scaled to zero and the rollout is marked as failed.
|
||||
|
||||
```text
|
||||
kubectl -n traefik logs deploy/flagger -f | jq .msg
|
||||
@@ -327,8 +323,7 @@ Edit the canary analysis and add the not found error rate check:
|
||||
interval: 1m
|
||||
```
|
||||
|
||||
The above configuration validates the canary by checking if the HTTP 404 req/sec percentage is
|
||||
below 5 percent of the total traffic. If the 404s rate reaches the 5% threshold, then the canary fails.
|
||||
The above configuration validates the canary by checking if the HTTP 404 req/sec percentage is below 5 percent of the total traffic. If the 404s rate reaches the 5% threshold, then the canary fails.
|
||||
|
||||
Trigger a canary deployment by updating the container image:
|
||||
|
||||
@@ -361,7 +356,7 @@ Rolling back podinfo.test failed checks threshold reached 5
|
||||
Canary failed! Scaling down podinfo.test
|
||||
```
|
||||
|
||||
If you have [alerting](../usage/alerting.md) configured,
|
||||
Flagger will send a notification with the reason why the canary failed.
|
||||
If you have [alerting](../usage/alerting.md) configured, Flagger will send a notification with the reason why the canary failed.
|
||||
|
||||
For an in-depth look at the analysis process read the [usage docs](../usage/how-it-works.md).
|
||||
|
||||
|
||||
@@ -1,50 +1,63 @@
|
||||
# Alerting
|
||||
|
||||
Flagger can be configured to send alerts to various chat platforms. You can define a global alert provider at
|
||||
install time or configure alerts on a per canary basis.
|
||||
Flagger can be configured to send alerts to various chat platforms.
|
||||
You can define a global alert provider at install time or configure alerts on a per canary basis.
|
||||
|
||||
### Global configuration
|
||||
## Global configuration
|
||||
|
||||
Flagger can be configured to send Slack notifications:
|
||||
### Slack
|
||||
|
||||
#### Slack Configuration
|
||||
|
||||
Flagger requires a custom webhook integration from slack, instead of the new slack app system.
|
||||
|
||||
The webhook can be generated by following the [legacy slack documentation](https://api.slack.com/legacy/custom-integrations/messaging/webhooks)
|
||||
|
||||
#### Flagger configuration
|
||||
|
||||
Once the webhook has been generated. Flagger can be configured to send Slack notifications:
|
||||
|
||||
```bash
|
||||
helm upgrade -i flagger flagger/flagger \
|
||||
--set slack.url=https://hooks.slack.com/services/YOUR/SLACK/WEBHOOK \
|
||||
--set slack.proxy-url=my-http-proxy.com \ # optional http/s proxy
|
||||
--set slack.channel=general \
|
||||
--set slack.user=flagger
|
||||
```
|
||||
|
||||
Once configured with a Slack incoming **webhook**, Flagger will post messages when a canary deployment
|
||||
has been initialised, when a new revision has been detected and if the canary analysis failed or succeeded.
|
||||
Once configured with a Slack incoming **webhook**,
|
||||
Flagger will post messages when a canary deployment has been initialised,
|
||||
when a new revision has been detected and if the canary analysis failed or succeeded.
|
||||
|
||||

|
||||

|
||||
|
||||
A canary deployment will be rolled back if the progress deadline exceeded or if the analysis reached the
|
||||
maximum number of failed checks:
|
||||
A canary deployment will be rolled back if the progress deadline exceeded
|
||||
or if the analysis reached the maximum number of failed checks:
|
||||
|
||||

|
||||

|
||||
|
||||
### Microsoft Teams
|
||||
|
||||
Flagger can be configured to send notifications to Microsoft Teams:
|
||||
|
||||
```bash
|
||||
helm upgrade -i flagger flagger/flagger \
|
||||
--set msteams.url=https://outlook.office.com/webhook/YOUR/TEAMS/WEBHOOK
|
||||
--set msteams.url=https://outlook.office.com/webhook/YOUR/TEAMS/WEBHOOK \
|
||||
--set msteams.proxy-url=my-http-proxy.com # optional http/s proxy
|
||||
```
|
||||
|
||||
Similar to Slack, Flagger alerts on canary analysis events:
|
||||
|
||||

|
||||
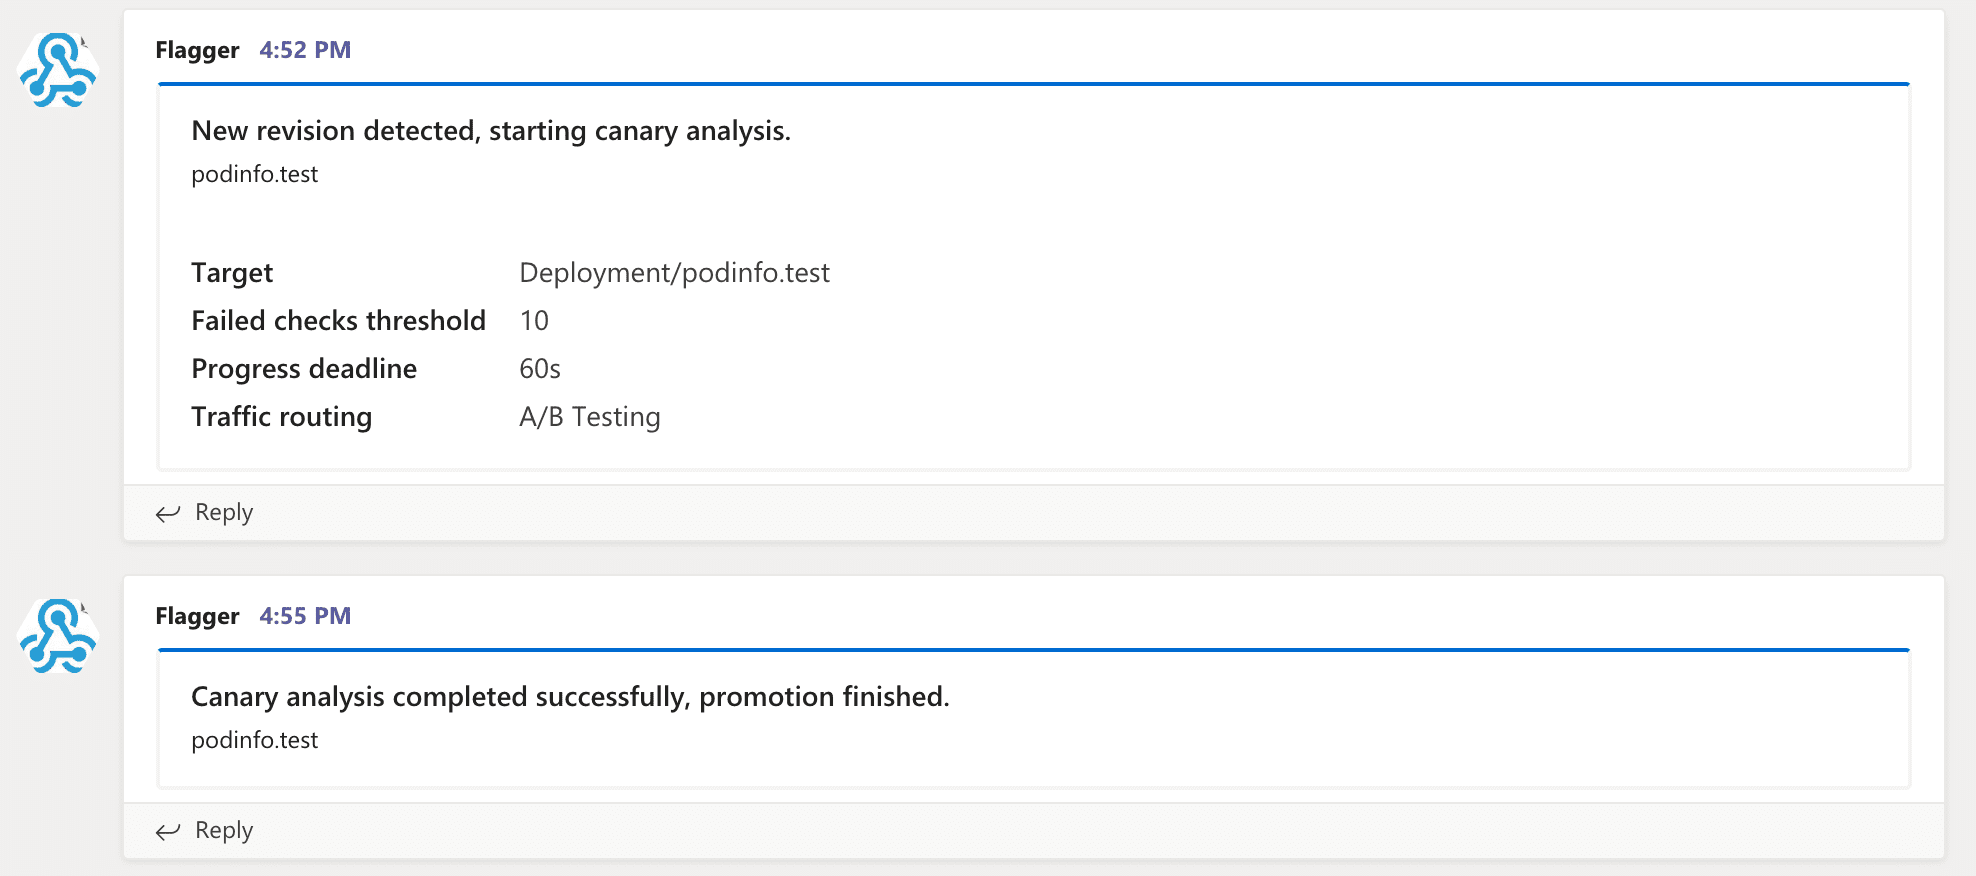
|
||||
|
||||

|
||||
|
||||
|
||||
### Canary configuration
|
||||
## Canary configuration
|
||||
|
||||
Configuring alerting globally has several limitations as it's not possible to specify different channels
|
||||
or configure the verbosity on a per canary basis.
|
||||
To make the alerting move flexible, the canary analysis can be extended
|
||||
with a list of alerts that reference an alert provider.
|
||||
For each alert, users can configure the severity level.
|
||||
The alerts section overrides the global setting.
|
||||
or configure the verbosity on a per canary basis. To make the alerting move flexible,
|
||||
the canary analysis can be extended with a list of alerts that reference an alert provider.
|
||||
For each alert, users can configure the severity level. The alerts section overrides the global setting.
|
||||
|
||||
Slack example:
|
||||
|
||||
@@ -60,6 +73,8 @@ spec:
|
||||
username: flagger
|
||||
# webhook address (ignored if secretRef is specified)
|
||||
address: https://hooks.slack.com/services/YOUR/SLACK/WEBHOOK
|
||||
# optional http/s proxy
|
||||
proxy: http://my-http-proxy.com
|
||||
# secret containing the webhook address (optional)
|
||||
secretRef:
|
||||
name: on-call-url
|
||||
@@ -103,15 +118,16 @@ The canary analysis can have a list of alerts, each alert referencing an alert p
|
||||
```
|
||||
|
||||
Alert fields:
|
||||
* **name** (required)
|
||||
|
||||
* **name** \(required\)
|
||||
* **severity** levels: `info`, `warn`, `error` (default info)
|
||||
* **providerRef.name** alert provider name (required)
|
||||
* **providerRef.namespace** alert provider namespace (defaults to the canary namespace)
|
||||
|
||||
When the severity is set to `warn`, Flagger will alert when waiting on manual confirmation or if the analysis fails.
|
||||
When the severity is set to `warn`, Flagger will alert when waiting on manual confirmation or if the analysis fails.
|
||||
When the severity is set to `error`, Flagger will alert only if the canary analysis fails.
|
||||
|
||||
### Prometheus Alert Manager
|
||||
## Prometheus Alert Manager
|
||||
|
||||
You can use Alertmanager to trigger alerts when a canary deployment failed:
|
||||
|
||||
@@ -125,4 +141,3 @@ You can use Alertmanager to trigger alerts when a canary deployment failed:
|
||||
summary: "Canary failed"
|
||||
description: "Workload {{ $labels.name }} namespace {{ $labels.namespace }}"
|
||||
```
|
||||
|
||||
|
||||
@@ -1,33 +1,34 @@
|
||||
# Deployment Strategies
|
||||
|
||||
Flagger can run automated application analysis, promotion and rollback for the following deployment strategies:
|
||||
* **Canary Release** (progressive traffic shifting)
|
||||
* Istio, Linkerd, App Mesh, NGINX, Skipper, Contour, Gloo, Traefik
|
||||
* **A/B Testing** (HTTP headers and cookies traffic routing)
|
||||
* Istio, App Mesh, NGINX, Contour
|
||||
* **Blue/Green** (traffic switching)
|
||||
* Kubernetes CNI, Istio, Linkerd, App Mesh, NGINX, Contour, Gloo
|
||||
* **Blue/Green Mirroring** (traffic shadowing)
|
||||
* Istio
|
||||
|
||||
For Canary releases and A/B testing you'll need a Layer 7 traffic management solution like a service mesh or an ingress controller.
|
||||
For Blue/Green deployments no service mesh or ingress controller is required.
|
||||
* **Canary Release** \(progressive traffic shifting\)
|
||||
* Istio, Linkerd, App Mesh, NGINX, Skipper, Contour, Gloo Edge, Traefik
|
||||
* **A/B Testing** \(HTTP headers and cookies traffic routing\)
|
||||
* Istio, App Mesh, NGINX, Contour, Gloo Edge
|
||||
* **Blue/Green** \(traffic switching\)
|
||||
* Kubernetes CNI, Istio, Linkerd, App Mesh, NGINX, Contour, Gloo Edge
|
||||
* **Blue/Green Mirroring** \(traffic shadowing\)
|
||||
* Istio
|
||||
|
||||
For Canary releases and A/B testing you'll need a Layer 7 traffic management solution like
|
||||
a service mesh or an ingress controller. For Blue/Green deployments no service mesh or ingress controller is required.
|
||||
|
||||
A canary analysis is triggered by changes in any of the following objects:
|
||||
|
||||
* Deployment PodSpec (container image, command, ports, env, resources, etc)
|
||||
* Deployment PodSpec \(container image, command, ports, env, resources, etc\)
|
||||
* ConfigMaps mounted as volumes or mapped to environment variables
|
||||
* Secrets mounted as volumes or mapped to environment variables
|
||||
|
||||
### Canary Release
|
||||
## Canary Release
|
||||
|
||||
Flagger implements a control loop that gradually shifts traffic to the canary while measuring key performance
|
||||
indicators like HTTP requests success rate, requests average duration and pod health.
|
||||
Flagger implements a control loop that gradually shifts traffic to the canary while measuring
|
||||
key performance indicators like HTTP requests success rate, requests average duration and pod health.
|
||||
Based on analysis of the KPIs a canary is promoted or aborted.
|
||||
|
||||

|
||||

|
||||
|
||||
The canary analysis runs periodically until it reaches the maximum traffic weight or the failed checks threshold.
|
||||
The canary analysis runs periodically until it reaches the maximum traffic weight or the failed checks threshold.
|
||||
|
||||
Spec:
|
||||
|
||||
@@ -54,61 +55,60 @@ Spec:
|
||||
The above analysis, if it succeeds, will run for 25 minutes while validating the HTTP metrics and webhooks every minute.
|
||||
You can determine the minimum time it takes to validate and promote a canary deployment using this formula:
|
||||
|
||||
```
|
||||
```text
|
||||
interval * (maxWeight / stepWeight)
|
||||
```
|
||||
|
||||
And the time it takes for a canary to be rollback when the metrics or webhook checks are failing:
|
||||
|
||||
```
|
||||
interval * threshold
|
||||
```text
|
||||
interval * threshold
|
||||
```
|
||||
|
||||
When `stepWeightPromotion` is specified, the promotion phase happens in stages,
|
||||
the traffic is routed back to the primary pods in a progressive manner,
|
||||
the primary weight is increased until it reaches 100%.
|
||||
When `stepWeightPromotion` is specified, the promotion phase happens in stages, the traffic is routed back
|
||||
to the primary pods in a progressive manner, the primary weight is increased until it reaches 100%.
|
||||
|
||||
In emergency cases, you may want to skip the analysis phase and ship changes directly to production.
|
||||
At any time you can set the `spec.skipAnalysis: true`.
|
||||
When skip analysis is enabled, Flagger checks if the canary deployment is healthy and
|
||||
promotes it without analysing it. If an analysis is underway, Flagger cancels it and runs the promotion.
|
||||
In emergency cases, you may want to skip the analysis phase and ship changes directly to production.
|
||||
At any time you can set the `spec.skipAnalysis: true`. When skip analysis is enabled,
|
||||
Flagger checks if the canary deployment is healthy and promotes it without analysing it.
|
||||
If an analysis is underway, Flagger cancels it and runs the promotion.
|
||||
|
||||
Gated canary promotion stages:
|
||||
|
||||
* scan for canary deployments
|
||||
* check primary and canary deployment status
|
||||
* halt advancement if a rolling update is underway
|
||||
* halt advancement if pods are unhealthy
|
||||
* halt advancement if a rolling update is underway
|
||||
* halt advancement if pods are unhealthy
|
||||
* call confirm-rollout webhooks and check results
|
||||
* halt advancement if any hook returns a non HTTP 2xx result
|
||||
* halt advancement if any hook returns a non HTTP 2xx result
|
||||
* call pre-rollout webhooks and check results
|
||||
* halt advancement if any hook returns a non HTTP 2xx result
|
||||
* increment the failed checks counter
|
||||
* increase canary traffic weight percentage from 0% to 2% (step weight)
|
||||
* halt advancement if any hook returns a non HTTP 2xx result
|
||||
* increment the failed checks counter
|
||||
* increase canary traffic weight percentage from 0% to 2% \(step weight\)
|
||||
* call rollout webhooks and check results
|
||||
* check canary HTTP request success rate and latency
|
||||
* halt advancement if any metric is under the specified threshold
|
||||
* increment the failed checks counter
|
||||
* halt advancement if any metric is under the specified threshold
|
||||
* increment the failed checks counter
|
||||
* check if the number of failed checks reached the threshold
|
||||
* route all traffic to primary
|
||||
* scale to zero the canary deployment and mark it as failed
|
||||
* call post-rollout webhooks
|
||||
* post the analysis result to Slack
|
||||
* wait for the canary deployment to be updated and start over
|
||||
* increase canary traffic weight by 2% (step weight) till it reaches 50% (max weight)
|
||||
* halt advancement if any webhook call fails
|
||||
* halt advancement while canary request success rate is under the threshold
|
||||
* halt advancement while canary request duration P99 is over the threshold
|
||||
* halt advancement while any custom metric check fails
|
||||
* halt advancement if the primary or canary deployment becomes unhealthy
|
||||
* halt advancement while canary deployment is being scaled up/down by HPA
|
||||
* route all traffic to primary
|
||||
* scale to zero the canary deployment and mark it as failed
|
||||
* call post-rollout webhooks
|
||||
* post the analysis result to Slack
|
||||
* wait for the canary deployment to be updated and start over
|
||||
* increase canary traffic weight by 2% \(step weight\) till it reaches 50% \(max weight\)
|
||||
* halt advancement if any webhook call fails
|
||||
* halt advancement while canary request success rate is under the threshold
|
||||
* halt advancement while canary request duration P99 is over the threshold
|
||||
* halt advancement while any custom metric check fails
|
||||
* halt advancement if the primary or canary deployment becomes unhealthy
|
||||
* halt advancement while canary deployment is being scaled up/down by HPA
|
||||
* call confirm-promotion webhooks and check results
|
||||
* halt advancement if any hook returns a non HTTP 2xx result
|
||||
* halt advancement if any hook returns a non HTTP 2xx result
|
||||
* promote canary to primary
|
||||
* copy ConfigMaps and Secrets from canary to primary
|
||||
* copy canary deployment spec template over primary
|
||||
* copy ConfigMaps and Secrets from canary to primary
|
||||
* copy canary deployment spec template over primary
|
||||
* wait for primary rolling update to finish
|
||||
* halt advancement if pods are unhealthy
|
||||
* halt advancement if pods are unhealthy
|
||||
* route all traffic to primary
|
||||
* scale to zero the canary deployment
|
||||
* mark rollout as finished
|
||||
@@ -116,11 +116,13 @@ Gated canary promotion stages:
|
||||
* send notification with the canary analysis result
|
||||
* wait for the canary deployment to be updated and start over
|
||||
|
||||
#### Rollout Weights
|
||||
### Rollout Weights
|
||||
|
||||
By default Flagger uses linear weight values for the promotion, with the start value, the step and the maximum weight value in 0 to 100 range.
|
||||
By default Flagger uses linear weight values for the promotion, with the start value,
|
||||
the step and the maximum weight value in 0 to 100 range.
|
||||
|
||||
Example:
|
||||
|
||||
```yaml
|
||||
canary:
|
||||
analysis:
|
||||
@@ -128,37 +130,44 @@ canary:
|
||||
maxWeight: 50
|
||||
stepWeight: 20
|
||||
```
|
||||
|
||||
This configuration performs analysis starting from 20, increasing by 20 until weight goes above 50.
|
||||
We would have steps (canary weight : primary weight):
|
||||
|
||||
* 20 (20 : 80)
|
||||
* 40 (40 : 60)
|
||||
* 60 (60 : 40)
|
||||
* promotion
|
||||
|
||||
In order to enable non-linear promotion a new parameter was introduced:
|
||||
|
||||
* `stepWeights` - determines the ordered array of weights, which shall be used during canary promotion.
|
||||
|
||||
Example:
|
||||
|
||||
```yaml
|
||||
canary:
|
||||
analysis:
|
||||
promotion:
|
||||
stepWeights: [1, 2, 10, 80]
|
||||
```
|
||||
|
||||
This configuration performs analysis starting from 1, going through `stepWeights` values till 80.
|
||||
We would have steps (canary weight : primary weight):
|
||||
|
||||
* 1 (1 : 99)
|
||||
* 2 (2 : 98)
|
||||
* 10 (10 : 90)
|
||||
* 80 (20 : 60)
|
||||
* promotion
|
||||
|
||||
### A/B Testing
|
||||
## A/B Testing
|
||||
|
||||
For frontend applications that require session affinity you should use HTTP headers or cookies match conditions
|
||||
to ensure a set of users will stay on the same version for the whole duration of the canary analysis.
|
||||
For frontend applications that require session affinity you should use
|
||||
HTTP headers or cookies match conditions to ensure a set of users
|
||||
will stay on the same version for the whole duration of the canary analysis.
|
||||
|
||||

|
||||

|
||||
|
||||
You can enable A/B testing by specifying the HTTP match conditions and the number of iterations.
|
||||
If Flagger finds a HTTP match condition, it will ignore the `maxWeight` and `stepWeight` settings.
|
||||
@@ -186,14 +195,14 @@ Istio example:
|
||||
The above configuration will run an analysis for ten minutes targeting the Safari users and those that have a test cookie.
|
||||
You can determine the minimum time that it takes to validate and promote a canary deployment using this formula:
|
||||
|
||||
```
|
||||
```text
|
||||
interval * iterations
|
||||
```
|
||||
|
||||
And the time it takes for a canary to be rollback when the metrics or webhook checks are failing:
|
||||
|
||||
```
|
||||
interval * threshold
|
||||
```text
|
||||
interval * threshold
|
||||
```
|
||||
|
||||
Istio example:
|
||||
@@ -216,13 +225,14 @@ Istio example:
|
||||
|
||||
The header keys must be lowercase and use hyphen as the separator.
|
||||
Header values are case-sensitive and formatted as follows:
|
||||
- `exact: "value"` for exact string match
|
||||
- `prefix: "value"` for prefix-based match
|
||||
- `suffix: "value"` for suffix-based match
|
||||
- `regex: "value"` for [RE2](https://github.com/google/re2/wiki/Syntax) style regex-based match
|
||||
|
||||
Note that the `sourceLabels` match conditions are applicable only when the `mesh` gateway
|
||||
is included in the `canary.service.gateways` list.
|
||||
* `exact: "value"` for exact string match
|
||||
* `prefix: "value"` for prefix-based match
|
||||
* `suffix: "value"` for suffix-based match
|
||||
* `regex: "value"` for [RE2](https://github.com/google/re2/wiki/Syntax) style regex-based match
|
||||
|
||||
Note that the `sourceLabels` match conditions are applicable only when
|
||||
the `mesh` gateway is included in the `canary.service.gateways` list.
|
||||
|
||||
App Mesh example:
|
||||
|
||||
@@ -270,24 +280,28 @@ NGINX example:
|
||||
exact: "canary"
|
||||
```
|
||||
|
||||
Note that the NGINX ingress controller supports only exact matching for cookies names where the value must be set to `always`.
|
||||
Note that the NGINX ingress controller supports only exact matching for
|
||||
cookies names where the value must be set to `always`.
|
||||
Starting with NGINX ingress v0.31, regex matching is supported for header values.
|
||||
|
||||
The above configurations will route users with the x-canary header or canary cookie to the canary instance during analysis:
|
||||
The above configurations will route users with the x-canary header
|
||||
or canary cookie to the canary instance during analysis:
|
||||
|
||||
```bash
|
||||
curl -H 'X-Canary: insider' http://app.example.com
|
||||
curl -b 'canary=always' http://app.example.com
|
||||
```
|
||||
|
||||
### Blue/Green Deployments
|
||||
## Blue/Green Deployments
|
||||
|
||||
For applications that are not deployed on a service mesh, Flagger can orchestrate blue/green style deployments
|
||||
with Kubernetes L4 networking. When using Istio you have the option to mirror traffic between blue and green.
|
||||
For applications that are not deployed on a service mesh,
|
||||
Flagger can orchestrate blue/green style deployments with Kubernetes L4 networking.
|
||||
When using Istio you have the option to mirror traffic between blue and green.
|
||||
|
||||

|
||||

|
||||
|
||||
You can use the blue/green deployment strategy by replacing `stepWeight/maxWeight` with `iterations` in the `analysis` spec:
|
||||
You can use the blue/green deployment strategy by replacing
|
||||
`stepWeight/maxWeight` with `iterations` in the `analysis` spec:
|
||||
|
||||
```yaml
|
||||
analysis:
|
||||
@@ -299,13 +313,14 @@ You can use the blue/green deployment strategy by replacing `stepWeight/maxWeigh
|
||||
threshold: 2
|
||||
```
|
||||
|
||||
With the above configuration Flagger will run conformance and load tests on the canary pods for ten minutes.
|
||||
If the metrics analysis succeeds, live traffic will be switched from the old version to the new one when the
|
||||
canary is promoted.
|
||||
With the above configuration Flagger will run conformance and load tests on the canary pods for ten minutes.
|
||||
If the metrics analysis succeeds, live traffic will be switched from
|
||||
the old version to the new one when the canary is promoted.
|
||||
|
||||
The blue/green deployment strategy is supported for all service mesh providers.
|
||||
|
||||
Blue/Green rollout steps for service mesh:
|
||||
|
||||
* detect new revision (deployment spec, secrets or configmaps changes)
|
||||
* scale up the canary (green)
|
||||
* run conformance tests for the canary pods
|
||||
@@ -317,24 +332,22 @@ Blue/Green rollout steps for service mesh:
|
||||
* route traffic to primary
|
||||
* scale down canary
|
||||
|
||||
After the analysis finishes, the traffic is routed to the canary (green) before triggering the primary (blue)
|
||||
rolling update, this ensures a smooth transition to the new version avoiding dropping in-flight requests during
|
||||
the Kubernetes deployment rollout.
|
||||
After the analysis finishes, the traffic is routed to the canary (green) before
|
||||
triggering the primary (blue) rolling update,
|
||||
this ensures a smooth transition to the new version avoiding dropping
|
||||
in-flight requests during the Kubernetes deployment rollout.
|
||||
|
||||
### Blue/Green with Traffic Mirroring
|
||||
## Blue/Green with Traffic Mirroring
|
||||
|
||||
Traffic Mirroring is a pre-stage in a Canary (progressive traffic shifting) or
|
||||
Blue/Green deployment strategy. Traffic mirroring will copy each incoming
|
||||
request, sending one request to the primary and one to the canary service.
|
||||
The response from the primary is sent back to the user. The response from the canary
|
||||
is discarded. Metrics are collected on both requests so that the deployment will
|
||||
only proceed if the canary metrics are healthy.
|
||||
Traffic Mirroring is a pre-stage in a Canary (progressive traffic shifting) or Blue/Green deployment strategy.
|
||||
Traffic mirroring will copy each incoming request, sending one request to the primary and one to the canary service.
|
||||
The response from the primary is sent back to the user. The response from the canary is discarded.
|
||||
Metrics are collected on both requests so that the deployment will only proceed if the canary metrics are healthy.
|
||||
|
||||
Mirroring should be used for requests that are **idempotent** or capable of
|
||||
being processed twice (once by the primary and once by the canary). Reads are
|
||||
idempotent. Before using mirroring on requests that may be writes, you should
|
||||
consider what will happen if a write is duplicated and handled by the primary
|
||||
and canary.
|
||||
Mirroring should be used for requests that are **idempotent** or capable of being processed
|
||||
twice (once by the primary and once by the canary).
|
||||
Reads are idempotent. Before using mirroring on requests that may be writes,
|
||||
you should consider what will happen if a write is duplicated and handled by the primary and canary.
|
||||
|
||||
To use mirroring, set `spec.analysis.mirror` to `true`.
|
||||
|
||||
@@ -355,6 +368,7 @@ Istio example:
|
||||
```
|
||||
|
||||
Mirroring rollout steps for service mesh:
|
||||
|
||||
* detect new revision (deployment spec, secrets or configmaps changes)
|
||||
* scale from zero the canary deployment
|
||||
* wait for the HPA to set the canary minimum replicas
|
||||
@@ -367,7 +381,7 @@ Mirroring rollout steps for service mesh:
|
||||
* abort the canary release if the failure threshold is reached
|
||||
* stop traffic mirroring after the number of iterations is reached
|
||||
* route live traffic to the canary pods
|
||||
* promote the canary (update the primary secrets, configmaps and deployment spec)
|
||||
* promote the canary \(update the primary secrets, configmaps and deployment spec\)
|
||||
* wait for the primary deployment rollout to finish
|
||||
* wait for the HPA to set the primary minimum replicas
|
||||
* check primary pods health
|
||||
@@ -375,6 +389,7 @@ Mirroring rollout steps for service mesh:
|
||||
* scale to zero the canary
|
||||
* send notification with the canary analysis result
|
||||
|
||||
After the analysis finishes, the traffic is routed to the canary (green) before triggering the primary (blue)
|
||||
rolling update, this ensures a smooth transition to the new version avoiding dropping in-flight requests during
|
||||
the Kubernetes deployment rollout.
|
||||
After the analysis finishes, the traffic is routed to the canary (green) before
|
||||
triggering the primary (blue) rolling update, this ensures a smooth transition
|
||||
to the new version avoiding dropping in-flight requests during the Kubernetes deployment rollout.
|
||||
|
||||
|
||||
@@ -1,12 +1,12 @@
|
||||
# How it works
|
||||
|
||||
[Flagger](https://github.com/weaveworks/flagger) can be configured to automate the release process
|
||||
for Kubernetes workloads with a custom resource named canary.
|
||||
[Flagger](https://github.com/fluxcd/flagger) can be configured to automate the release process for
|
||||
Kubernetes workloads with a custom resource named canary.
|
||||
|
||||
### Canary resource
|
||||
## Canary resource
|
||||
|
||||
The canary custom resource defines the release process of an application running on Kubernetes
|
||||
and is portable across clusters, service meshes and ingress providers.
|
||||
The canary custom resource defines the release process of an application running on Kubernetes and is
|
||||
portable across clusters, service meshes and ingress providers.
|
||||
|
||||
For a deployment named _podinfo_, a canary release with progressive traffic shifting can be defined as:
|
||||
|
||||
@@ -43,15 +43,15 @@ spec:
|
||||
cmd: "hey -z 1m -q 10 -c 2 http://podinfo-canary.test:9898/"
|
||||
```
|
||||
|
||||
When you deploy a new version of an app, Flagger gradually shifts traffic to the canary,
|
||||
and at the same time, measures the requests success rate as well as the average response duration.
|
||||
You can extend the canary analysis with custom metrics, acceptance and load testing
|
||||
to harden the validation process of your app release process.
|
||||
When you deploy a new version of an app, Flagger gradually shifts traffic to the canary, and at the same time,
|
||||
measures the requests success rate as well as the average response duration.
|
||||
You can extend the canary analysis with custom metrics,
|
||||
acceptance and load testing to harden the validation process of your app release process.
|
||||
|
||||
If you are running multiple service meshes or ingress controllers in the same cluster,
|
||||
you can override the global provider for a specific canary with `spec.provider`.
|
||||
|
||||
### Canary target
|
||||
## Canary target
|
||||
|
||||
A canary resource can target a Kubernetes Deployment or DaemonSet.
|
||||
|
||||
@@ -75,10 +75,10 @@ Based on the above configuration, Flagger generates the following Kubernetes obj
|
||||
* `deployment/<targetRef.name>-primary`
|
||||
* `hpa/<autoscalerRef.name>-primary`
|
||||
|
||||
The primary deployment is considered the stable release of your app, by default all traffic is routed to this version
|
||||
and the target deployment is scaled to zero.
|
||||
Flagger will detect changes to the target deployment (including secrets and configmaps) and will perform a
|
||||
canary analysis before promoting the new version as primary.
|
||||
The primary deployment is considered the stable release of your app,
|
||||
by default all traffic is routed to this version and the target deployment is scaled to zero.
|
||||
Flagger will detect changes to the target deployment (including secrets and configmaps)
|
||||
and will perform a canary analysis before promoting the new version as primary.
|
||||
|
||||
**Note** that the target deployment must have a single label selector in the format `app: <DEPLOYMENT-NAME>`:
|
||||
|
||||
@@ -98,26 +98,28 @@ spec:
|
||||
```
|
||||
|
||||
In addition to `app`, Flagger supports `name` and `app.kubernetes.io/name` selectors.
|
||||
If you use a different convention you can specify your label with
|
||||
the `-selector-labels=my-app-label` command flag in the Flagger deployment manifest under containers args
|
||||
If you use a different convention you can specify your label with the `-selector-labels=my-app-label`
|
||||
command flag in the Flagger deployment manifest under containers args
|
||||
or by setting `--set selectorLabels=my-app-label` when installing Flagger with Helm.
|
||||
|
||||
If the target deployment uses secrets and/or configmaps, Flagger will create a copy of each object using the `-primary`
|
||||
suffix and will reference these objects in the primary deployment. If you annotate your ConfigMap or Secret with
|
||||
`flagger.app/config-tracking: disabled`, Flagger will use the same object for the primary deployment instead of making
|
||||
a primary copy.
|
||||
You can disable the secrets/configmaps tracking globally with the `-enable-config-tracking=false` command flag in
|
||||
the Flagger deployment manifest under containers args or by setting `--set configTracking.enabled=false` when
|
||||
installing Flagger with Helm, but disabling config-tracking using the the per Secret/ConfigMap annotation may fit your
|
||||
use-case better.
|
||||
If the target deployment uses secrets and/or configmaps,
|
||||
Flagger will create a copy of each object using the `-primary` suffix
|
||||
and will reference these objects in the primary deployment.
|
||||
If you annotate your ConfigMap or Secret with `flagger.app/config-tracking: disabled`,
|
||||
Flagger will use the same object for the primary deployment instead of making a primary copy.
|
||||
You can disable the secrets/configmaps tracking globally with the `-enable-config-tracking=false`
|
||||
command flag in the Flagger deployment manifest under containers args
|
||||
or by setting `--set configTracking.enabled=false` when installing Flagger with Helm,
|
||||
but disabling config-tracking using the per Secret/ConfigMap annotation may fit your use-case better.
|
||||
|
||||
The autoscaler reference is optional, when specified, Flagger will pause the traffic increase while the
|
||||
target and primary deployments are scaled up or down. HPA can help reduce the resource usage during the canary analysis.
|
||||
The autoscaler reference is optional, when specified,
|
||||
Flagger will pause the traffic increase while the target and primary deployments are scaled up or down.
|
||||
HPA can help reduce the resource usage during the canary analysis.
|
||||
|
||||
The progress deadline represents the maximum time in seconds for the canary deployment to make progress
|
||||
before it is rolled back, defaults to ten minutes.
|
||||
The progress deadline represents the maximum time in seconds for the canary deployment to
|
||||
make progress before it is rolled back, defaults to ten minutes.
|
||||
|
||||
### Canary service
|
||||
## Canary service
|
||||
|
||||
A canary resource dictates how the target workload is exposed inside the cluster.
|
||||
The canary target should expose a TCP port that will be used by Flagger to create the ClusterIP Services.
|
||||
@@ -137,22 +139,27 @@ The `service.name` is optional, defaults to `spec.targetRef.name`.
|
||||
The `service.targetPort` can be a container port number or name.
|
||||
The `service.portName` is optional (defaults to `http`), if your workload uses gRPC then set the port name to `grpc`.
|
||||
|
||||
If port discovery is enabled, Flagger scans the target workload and extracts the containers
|
||||
ports excluding the port specified in the canary service and service mesh sidecar ports.
|
||||
If port discovery is enabled, Flagger scans the target workload and extracts the containers ports
|
||||
excluding the port specified in the canary service and service mesh sidecar ports.
|
||||
These ports will be used when generating the ClusterIP services.
|
||||
|
||||
Based on the canary spec service, Flagger creates the following Kubernetes ClusterIP service:
|
||||
|
||||
* `<service.name>.<namespace>.svc.cluster.local`
|
||||
|
||||
selector `app=<name>-primary`
|
||||
|
||||
* `<service.name>-primary.<namespace>.svc.cluster.local`
|
||||
|
||||
selector `app=<name>-primary`
|
||||
|
||||
* `<service.name>-canary.<namespace>.svc.cluster.local`
|
||||
|
||||
selector `app=<name>`
|
||||
|
||||
This ensures that traffic to `podinfo.test:9898` will be routed to the latest stable release of your app.
|
||||
The `podinfo-canary.test:9898` address is available only during the
|
||||
canary analysis and can be used for conformance testing or load testing.
|
||||
This ensures that traffic to `podinfo.test:9898` will be routed to the latest stable release of your app.
|
||||
The `podinfo-canary.test:9898` address is available only during the canary analysis
|
||||
and can be used for conformance testing or load testing.
|
||||
|
||||
You can configure Flagger to set annotations and labels for the generated services with:
|
||||
|
||||
@@ -177,8 +184,8 @@ spec:
|
||||
test: "test"
|
||||
```
|
||||
|
||||
Besides port mapping and metadata, the service specification can contain URI match and rewrite rules,
|
||||
timeout and retry polices:
|
||||
Besides port mapping and metadata, the service specification can
|
||||
contain URI match and rewrite rules, timeout and retry polices:
|
||||
|
||||
```yaml
|
||||
spec:
|
||||
@@ -195,13 +202,13 @@ spec:
|
||||
timeout: 5s
|
||||
```
|
||||
|
||||
When using **Istio** as the mesh provider, you can also specify
|
||||
HTTP header operations, CORS and traffic policies, Istio gateways and hosts.
|
||||
When using **Istio** as the mesh provider, you can also specify HTTP header operations,
|
||||
CORS and traffic policies, Istio gateways and hosts.
|
||||
The Istio routing configuration can be found [here](../faq.md#istio-routing).
|
||||
|
||||
### Canary status
|
||||
|
||||
You can use kubectl to get the current status of canary deployments cluster wide:
|
||||
## Canary status
|
||||
|
||||
You can use kubectl to get the current status of canary deployments cluster wide:
|
||||
|
||||
```bash
|
||||
kubectl get canaries --all-namespaces
|
||||
@@ -237,7 +244,7 @@ status:
|
||||
```
|
||||
|
||||
The `Promoted` status condition can have one of the following reasons:
|
||||
Initialized, Waiting, Progressing, Promoting, Finalising, Succeeded or Failed.
|
||||
Initialized, Waiting, Progressing, WaitingPromotion, Promoting, Finalising, Succeeded or Failed.
|
||||
A failed canary will have the promoted status set to `false`,
|
||||
the reason to `failed` and the last applied spec will be different to the last promoted one.
|
||||
|
||||
@@ -267,14 +274,15 @@ kubectl wait canary/podinfo --for=condition=promoted --timeout=5m
|
||||
kubectl get canary/podinfo | grep Succeeded
|
||||
```
|
||||
|
||||
### Canary finalizers
|
||||
## Canary finalizers
|
||||
|
||||
The default behavior of Flagger on canary deletion is to leave resources that aren't owned by the controller
|
||||
in their current state. This simplifies the deletion action and avoids possible deadlocks during resource
|
||||
finalization. In the event the canary was introduced with existing resource(s) (i.e. service, virtual service, etc.),
|
||||
they would be mutated during the initialization phase and no longer reflect their initial state. If the desired
|
||||
functionality upon deletion is to revert the resources to their initial state, the `revertOnDeletion` attribute
|
||||
can be enabled.
|
||||
The default behavior of Flagger on canary deletion is to leave resources that aren't owned
|
||||
by the controller in their current state.
|
||||
This simplifies the deletion action and avoids possible deadlocks during resource finalization.
|
||||
In the event the canary was introduced with existing resource(s) (i.e. service, virtual service, etc.),
|
||||
they would be mutated during the initialization phase and no longer reflect their initial state.
|
||||
If the desired functionality upon deletion is to revert the resources to their initial state,
|
||||
the `revertOnDeletion` attribute can be enabled.
|
||||
|
||||
```yaml
|
||||
spec:
|
||||
@@ -283,19 +291,21 @@ spec:
|
||||
|
||||
When a deletion action is submitted to the cluster, Flagger will attempt to revert the following resources:
|
||||
|
||||
* [Canary target](#canary-target) replicas will be updated to the primary replica count
|
||||
* [Canary service](#canary-service) selector will be reverted
|
||||
* [Canary target](how-it-works.md#canary-target) replicas will be updated to the primary replica count
|
||||
* [Canary service](how-it-works.md#canary-service) selector will be reverted
|
||||
* Mesh/Ingress traffic routed to the target
|
||||
|
||||
The recommended approach to disable canary analysis would be utilization of the `skipAnalysis`
|
||||
attribute, which limits the need for resource reconciliation. Utilizing the `revertOnDeletion` attribute should be
|
||||
enabled when you no longer plan to rely on Flagger for deployment management.
|
||||
The recommended approach to disable canary analysis would be utilization of the `skipAnalysis` attribute,
|
||||
which limits the need for resource reconciliation.
|
||||
Utilizing the `revertOnDeletion` attribute should be enabled when
|
||||
you no longer plan to rely on Flagger for deployment management.
|
||||
|
||||
**Note** When this feature is enabled expect a delay in the delete action due to the reconciliation.
|
||||
**Note** When this feature is enabled expect a delay in the delete action due to the reconciliation.
|
||||
|
||||
### Canary analysis
|
||||
## Canary analysis
|
||||
|
||||
The canary analysis defines:
|
||||
|
||||
* the type of [deployment strategy](deployment-strategies.md)
|
||||
* the [metrics](metrics.md) used to validate the canary version
|
||||
* the [webhooks](webhooks.md) used for conformance testing, load testing and manual gating
|
||||
@@ -337,5 +347,7 @@ Spec:
|
||||
```
|
||||
|
||||
The canary analysis runs periodically until it reaches the maximum traffic weight or the number of iterations.
|
||||
On each run, Flagger calls the webhooks, checks the metrics and if the failed checks threshold is reached, stops the
|
||||
analysis and rolls back the canary. If alerting is configured, Flagger will post the analysis result using the alert providers.
|
||||
On each run, Flagger calls the webhooks, checks the metrics and if the failed checks threshold is reached,
|
||||
stops the analysis and rolls back the canary.
|
||||
If alerting is configured, Flagger will post the analysis result using the alert providers.
|
||||
|
||||
|
||||
@@ -1,11 +1,12 @@
|
||||
# Metrics Analysis
|
||||
|
||||
As part of the analysis process, Flagger can validate service level objectives (SLOs) like
|
||||
availability, error rate percentage, average response time and any other objective based on app specific metrics.
|
||||
As part of the analysis process, Flagger can validate service level objectives
|
||||
(SLOs) like availability, error rate percentage, average response time and any other objective
|
||||
based on app specific metrics.
|
||||
If a drop in performance is noticed during the SLOs analysis,
|
||||
the release will be automatically rolled back with minimum impact to end-users.
|
||||
|
||||
### Builtin metrics
|
||||
## Builtin metrics
|
||||
|
||||
Flagger comes with two builtin metric checks: HTTP request success rate and duration.
|
||||
|
||||
@@ -26,15 +27,16 @@ Flagger comes with two builtin metric checks: HTTP request success rate and dura
|
||||
max: 500
|
||||
```
|
||||
|
||||
For each metric you can specify a range of accepted values with `thresholdRange`
|
||||
and the window size or the time series with `interval`.
|
||||
The builtin checks are available for every service mesh / ingress controller
|
||||
For each metric you can specify a range of accepted values with `thresholdRange` and
|
||||
the window size or the time series with `interval`.
|
||||
The builtin checks are available for every service mesh / ingress controlle
|
||||
and are implemented with [Prometheus queries](../faq.md#metrics).
|
||||
|
||||
### Custom metrics
|
||||
## Custom metrics
|
||||
|
||||
The canary analysis can be extended with custom metric checks. Using a `MetricTemplate` custom resource, you
|
||||
configure Flagger to connect to a metric provider and run a query that returns a `float64` value.
|
||||
The canary analysis can be extended with custom metric checks.
|
||||
Using a `MetricTemplate` custom resource,
|
||||
you configure Flagger to connect to a metric provider and run a query that returns a `float64` value.
|
||||
The query result is used to validate the canary based on the specified threshold range.
|
||||
|
||||
```yaml
|
||||
@@ -53,12 +55,12 @@ spec:
|
||||
|
||||
The following variables are available in query templates:
|
||||
|
||||
- `name` (canary.metadata.name)
|
||||
- `namespace` (canary.metadata.namespace)
|
||||
- `target` (canary.spec.targetRef.name)
|
||||
- `service` (canary.spec.service.name)
|
||||
- `ingress` (canary.spec.ingresRef.name)
|
||||
- `interval` (canary.spec.analysis.metrics[].interval)
|
||||
* `name` (canary.metadata.name)
|
||||
* `namespace` (canary.metadata.namespace)
|
||||
* `target` (canary.spec.targetRef.name)
|
||||
* `service` (canary.spec.service.name)
|
||||
* `ingress` (canary.spec.ingresRef.name)
|
||||
* `interval` (canary.spec.analysis.metrics[].interval)
|
||||
|
||||
A canary analysis metric can reference a template with `templateRef`:
|
||||
|
||||
@@ -79,10 +81,10 @@ A canary analysis metric can reference a template with `templateRef`:
|
||||
interval: 1m
|
||||
```
|
||||
|
||||
### Prometheus
|
||||
## Prometheus
|
||||
|
||||
You can create custom metric checks targeting a Prometheus server
|
||||
by setting the provider type to `prometheus` and writing the query in PromQL.
|
||||
You can create custom metric checks targeting a Prometheus server by
|
||||
setting the provider type to `prometheus` and writing the query in PromQL.
|
||||
|
||||
Prometheus template example:
|
||||
|
||||
@@ -133,9 +135,8 @@ Reference the template in the canary analysis:
|
||||
interval: 1m
|
||||
```
|
||||
|
||||
The above configuration validates the canary by checking
|
||||
if the HTTP 404 req/sec percentage is below 5 percent of the total traffic.
|
||||
If the 404s rate reaches the 5% threshold, then the canary fails.
|
||||
The above configuration validates the canary by checking if the HTTP 404 req/sec percentage
|
||||
is below 5 percent of the total traffic. If the 404s rate reaches the 5% threshold, then the canary fails.
|
||||
|
||||
Prometheus gRPC error rate example:
|
||||
|
||||
@@ -170,12 +171,13 @@ spec:
|
||||
) * 100
|
||||
```
|
||||
|
||||
The above template is for gRPC services instrumented with [go-grpc-prometheus](https://github.com/grpc-ecosystem/go-grpc-prometheus).
|
||||
The above template is for gRPC services instrumented with
|
||||
[go-grpc-prometheus](https://github.com/grpc-ecosystem/go-grpc-prometheus).
|
||||
|
||||
### Prometheus authentication
|
||||
## Prometheus authentication
|
||||
|
||||
If your Prometheus API requires basic authentication, you can create a secret
|
||||
in the same namespace as the `MetricTemplate` with the basic-auth credentials:
|
||||
If your Prometheus API requires basic authentication, you can create a secret in the same namespace
|
||||
as the `MetricTemplate` with the basic-auth credentials:
|
||||
|
||||
```yaml
|
||||
apiVersion: v1
|
||||
@@ -204,7 +206,7 @@ spec:
|
||||
name: prom-basic-auth
|
||||
```
|
||||
|
||||
### Datadog
|
||||
## Datadog
|
||||
|
||||
You can create custom metric checks using the Datadog provider.
|
||||
|
||||
@@ -266,8 +268,7 @@ Reference the template in the canary analysis:
|
||||
interval: 1m
|
||||
```
|
||||
|
||||
|
||||
### Amazon CloudWatch
|
||||
## Amazon CloudWatch
|
||||
|
||||
You can create custom metric checks using the CloudWatch metrics provider.
|
||||
|
||||
@@ -330,7 +331,8 @@ spec:
|
||||
]
|
||||
```
|
||||
|
||||
The query format documentation can be found [here](https://aws.amazon.com/premiumsupport/knowledge-center/cloudwatch-getmetricdata-api/).
|
||||
The query format documentation can be found
|
||||
[here](https://aws.amazon.com/premiumsupport/knowledge-center/cloudwatch-getmetricdata-api/).
|
||||
|
||||
Reference the template in the canary analysis:
|
||||
|
||||
@@ -347,7 +349,7 @@ Reference the template in the canary analysis:
|
||||
|
||||
**Note** that Flagger need AWS IAM permission to perform `cloudwatch:GetMetricData` to use this provider.
|
||||
|
||||
### New Relic
|
||||
## New Relic
|
||||
|
||||
You can create custom metric checks using the New Relic provider.
|
||||
|
||||
|
||||
@@ -6,13 +6,12 @@ Flagger comes with a Grafana dashboard made for canary analysis. Install Grafana
|
||||
|
||||
```bash
|
||||
helm upgrade -i flagger-grafana flagger/grafana \
|
||||
--namespace=istio-system \ # or appmesh-system
|
||||
--set url=http://prometheus:9090
|
||||
```
|
||||
|
||||
The dashboard shows the RED and USE metrics for the primary and canary workloads:
|
||||
|
||||

|
||||

|
||||
|
||||
## Logging
|
||||
|
||||
@@ -49,9 +48,11 @@ helm upgrade -i flagger flagger/flagger \
|
||||
--set eventWebhook=https://example.com/flagger-canary-event-webhook
|
||||
```
|
||||
|
||||
The environment variable _EVENT\_WEBHOOK\_URL_ can be used for activating the event-webhook, too. This is handy for using a secret to store a sensible value that could contain api keys for example.
|
||||
The environment variable _EVENT\_WEBHOOK\_URL_ can be used for activating the event-webhook, too.
|
||||
This is handy for using a secret to store a sensible value that could contain api keys for example.
|
||||
|
||||
When configured, every action that Flagger takes during a canary deployment will be sent as JSON via an HTTP POST request. The JSON payload has the following schema:
|
||||
When configured, every action that Flagger takes during a canary deployment
|
||||
will be sent as JSON via an HTTP POST request. The JSON payload has the following schema:
|
||||
|
||||
```javascript
|
||||
{
|
||||
@@ -93,7 +94,8 @@ The event webhook can be overwritten at canary level with:
|
||||
|
||||
## Metrics
|
||||
|
||||
Flagger exposes Prometheus metrics that can be used to determine the canary analysis status and the destination weight values:
|
||||
Flagger exposes Prometheus metrics that can be used to determine
|
||||
the canary analysis status and the destination weight values:
|
||||
|
||||
```bash
|
||||
# Flagger version and mesh provider gauge
|
||||
@@ -116,4 +118,3 @@ flagger_canary_duration_seconds_bucket{name="podinfo",namespace="test",le="+Inf"
|
||||
flagger_canary_duration_seconds_sum{name="podinfo",namespace="test"} 17.3561329
|
||||
flagger_canary_duration_seconds_count{name="podinfo",namespace="test"} 6
|
||||
```
|
||||
|
||||
|
||||
@@ -1,26 +1,37 @@
|
||||
# Webhooks
|
||||
|
||||
The canary analysis can be extended with webhooks. Flagger will call each webhook URL and
|
||||
determine from the response status code (HTTP 2xx) if the canary is failing or not.
|
||||
The canary analysis can be extended with webhooks.
|
||||
Flagger will call each webhook URL and determine from the response status code
|
||||
(HTTP 2xx) if the canary is failing or not.
|
||||
|
||||
There are several types of hooks:
|
||||
|
||||
* **confirm-rollout** hooks are executed before scaling up the canary deployment and can be used for manual approval.
|
||||
The rollout is paused until the hook returns a successful HTTP status code.
|
||||
* **pre-rollout** hooks are executed before routing traffic to canary.
|
||||
The canary advancement is paused if a pre-rollout hook fails and if the number of failures reach the
|
||||
threshold the canary will be rollback.
|
||||
* **rollout** hooks are executed during the analysis on each iteration before the metric checks.
|
||||
If a rollout hook call fails the canary advancement is paused and eventfully rolled back.
|
||||
The rollout is paused until the hook returns a successful HTTP status code.
|
||||
|
||||
* **pre-rollout** hooks are executed before routing traffic to canary.
|
||||
The canary advancement is paused if a pre-rollout hook fails and if the number of failures reach the
|
||||
threshold the canary will be rollback.
|
||||
|
||||
* **rollout** hooks are executed during the analysis on each iteration before the metric checks.
|
||||
If a rollout hook call fails the canary advancement is paused and eventfully rolled back.
|
||||
|
||||
* **confirm-traffic-increase** hooks are executed right before the weight on the canary is increased. The canary
|
||||
advancement is paused until this hook returns HTTP 200.
|
||||
|
||||
* **confirm-promotion** hooks are executed before the promotion step.
|
||||
The canary promotion is paused until the hooks return HTTP 200.
|
||||
While the promotion is paused, Flagger will continue to run the metrics checks and rollout hooks.
|
||||
* **post-rollout** hooks are executed after the canary has been promoted or rolled back.
|
||||
If a post rollout hook fails the error is logged.
|
||||
The canary promotion is paused until the hooks return HTTP 200.
|
||||
While the promotion is paused, Flagger will continue to run the metrics checks and rollout hooks.
|
||||
|
||||
* **post-rollout** hooks are executed after the canary has been promoted or rolled back.
|
||||
If a post rollout hook fails the error is logged.
|
||||
|
||||
* **rollback** hooks are executed while a canary deployment is in either Progressing or Waiting status.
|
||||
This provides the ability to rollback during analysis or while waiting for a confirmation. If a rollback hook
|
||||
returns a successful HTTP status code, Flagger will stop the analysis and mark the canary release as failed.
|
||||
This provides the ability to rollback during analysis or while waiting for a confirmation. If a rollback hook
|
||||
returns a successful HTTP status code, Flagger will stop the analysis and mark the canary release as failed.
|
||||
|
||||
* **event** hooks are executed every time Flagger emits a Kubernetes event. When configured,
|
||||
every action that Flagger takes during a canary deployment will be sent as JSON via an HTTP POST request.
|
||||
every action that Flagger takes during a canary deployment will be sent as JSON via an HTTP POST request.
|
||||
|
||||
Spec:
|
||||
|
||||
@@ -43,6 +54,9 @@ Spec:
|
||||
timeout: 15s
|
||||
metadata:
|
||||
cmd: "hey -z 1m -q 5 -c 2 http://podinfo-canary.test:9898/"
|
||||
- name: "traffic increase gate"
|
||||
type: confirm-traffic-increase
|
||||
url: http://flagger-loadtester.test/gate/approve
|
||||
- name: "promotion gate"
|
||||
type: confirm-promotion
|
||||
url: http://flagger-loadtester.test/gate/approve
|
||||
@@ -58,13 +72,16 @@ Spec:
|
||||
- name: "send to Slack"
|
||||
type: event
|
||||
url: http://event-recevier.notifications/slack
|
||||
metadata:
|
||||
environment: "test"
|
||||
cluster: "flagger-test"
|
||||
```
|
||||
|
||||
> **Note** that the sum of all rollout webhooks timeouts should be lower than the analysis interval.
|
||||
> **Note** that the sum of all rollout webhooks timeouts should be lower than the analysis interval.
|
||||
|
||||
Webhook payload (HTTP POST):
|
||||
|
||||
```json
|
||||
```javascript
|
||||
{
|
||||
"name": "podinfo",
|
||||
"namespace": "test",
|
||||
@@ -85,7 +102,7 @@ On a non-2xx response Flagger will include the response body (if any) in the fai
|
||||
|
||||
Event payload (HTTP POST):
|
||||
|
||||
```json
|
||||
```javascript
|
||||
{
|
||||
"name": "string (canary name)",
|
||||
"namespace": "string (canary namespace)",
|
||||
@@ -98,25 +115,25 @@ Event payload (HTTP POST):
|
||||
}
|
||||
```
|
||||
|
||||
The event receiver can create alerts based on the received phase
|
||||
(possible values: ` Initialized`, `Waiting`, `Progressing`, `Promoting`, `Finalising`, `Succeeded` or `Failed`).
|
||||
The event receiver can create alerts based on the received phase
|
||||
(possible values: `Initialized`, `Waiting`, `Progressing`, `Promoting`, `Finalising`, `Succeeded` or `Failed`).
|
||||
|
||||
### Load Testing
|
||||
## Load Testing
|
||||
|
||||
For workloads that are not receiving constant traffic Flagger can be configured with a webhook,
|
||||
For workloads that are not receiving constant traffic Flagger can be configured with a webhook,
|
||||
that when called, will start a load test for the target workload.
|
||||
If the target workload doesn't receive any traffic during the canary analysis,
|
||||
If the target workload doesn't receive any traffic during the canary analysis,
|
||||
Flagger metric checks will fail with "no values found for metric request-success-rate".
|
||||
|
||||
Flagger comes with a load testing service based on [rakyll/hey](https://github.com/rakyll/hey)
|
||||
Flagger comes with a load testing service based on [rakyll/hey](https://github.com/rakyll/hey)
|
||||
that generates traffic during analysis when configured as a webhook.
|
||||
|
||||
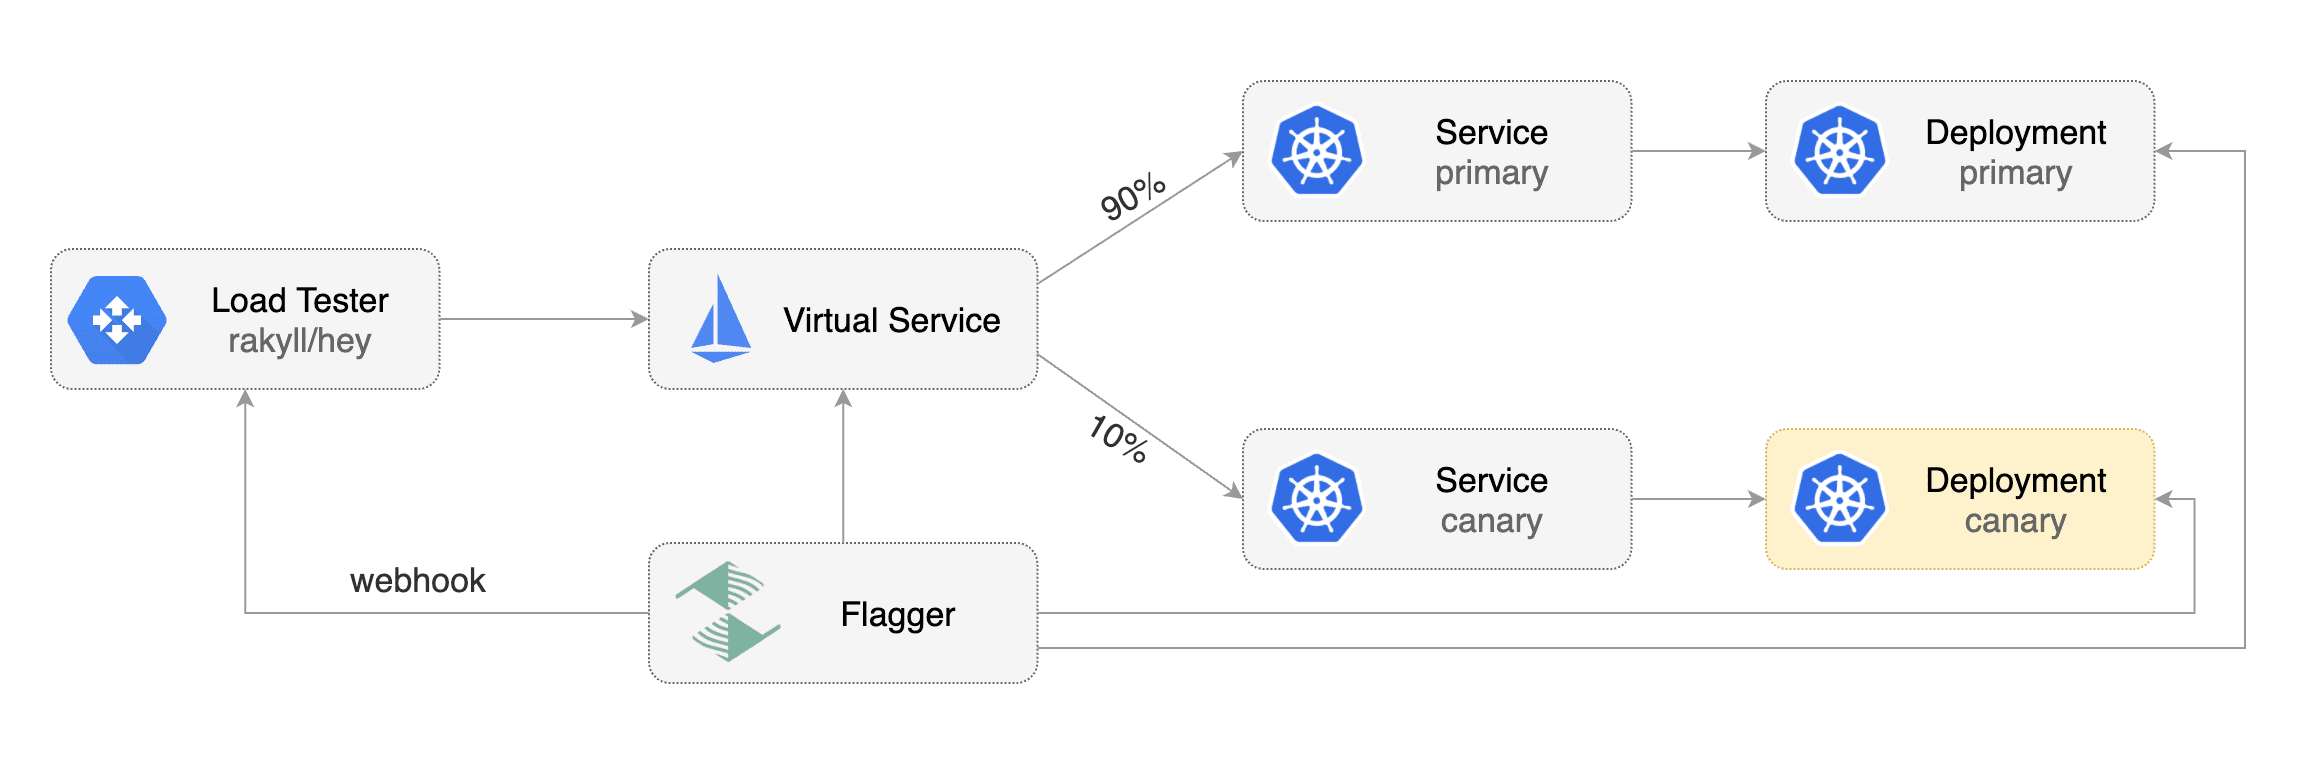
|
||||

|
||||
|
||||
First you need to deploy the load test runner in a namespace with sidecar injection enabled:
|
||||
|
||||
```bash
|
||||
kubectl apply -k github.com/weaveworks/flagger//kustomize/tester
|
||||
kubectl apply -k https://github.com/fluxcd/flagger//kustomize/tester?ref=main
|
||||
```
|
||||
|
||||
Or by using Helm:
|
||||
@@ -129,7 +146,7 @@ helm upgrade -i flagger-loadtester flagger/loadtester \
|
||||
--set cmd.timeout=1h
|
||||
```
|
||||
|
||||
When deployed the load tester API will be available at `http://flagger-loadtester.test/`.
|
||||
When deployed the load tester API will be available at `http://flagger-loadtester.test/`.
|
||||
|
||||
Now you can add webhooks to the canary analysis spec:
|
||||
|
||||
@@ -149,12 +166,12 @@ webhooks:
|
||||
cmd: "hey -z 1m -q 10 -c 2 -m POST -d '{test: 2}' http://podinfo-canary.test:9898/echo"
|
||||
```
|
||||
|
||||
When the canary analysis starts, Flagger will call the webhooks and the load tester will run the `hey` commands
|
||||
in the background, if they are not already running. This will ensure that during the
|
||||
analysis, the `podinfo-canary.test` service will receive a steady stream of GET and POST requests.
|
||||
When the canary analysis starts, Flagger will call the webhooks and the load tester will
|
||||
run the `hey` commands in the background, if they are not already running.
|
||||
This will ensure that during the analysis, the `podinfo-canary.test`
|
||||
service will receive a steady stream of GET and POST requests.
|
||||
|
||||
If your workload is exposed outside the mesh you can point `hey` to the
|
||||
public URL and use HTTP2.
|
||||
If your workload is exposed outside the mesh you can point `hey` to the public URL and use HTTP2.
|
||||
|
||||
```yaml
|
||||
webhooks:
|
||||
@@ -178,7 +195,11 @@ webhooks:
|
||||
cmd: "ghz -z 1m -q 10 -c 2 --insecure podinfo.test:9898"
|
||||
```
|
||||
|
||||
`ghz` uses reflection to identify which gRPC method to call. If you do not wish to enable reflection for your gRPC service you can implement a standardized health check from the [grpc-proto](https://github.com/grpc/grpc-proto) library. To use this [health check schema](https://github.com/grpc/grpc-proto/blob/master/grpc/health/v1/health.proto) without reflection you can pass a parameter to `ghz` like this
|
||||
`ghz` uses reflection to identify which gRPC method to call.
|
||||
If you do not wish to enable reflection for your gRPC service you can implement a standardized
|
||||
health check from the [grpc-proto](https://github.com/grpc/grpc-proto) library.
|
||||
To use this [health check schema](https://github.com/grpc/grpc-proto/blob/master/grpc/health/v1/health.proto)
|
||||
without reflection you can pass a parameter to `ghz` like this
|
||||
|
||||
```yaml
|
||||
webhooks:
|
||||
@@ -191,19 +212,19 @@ webhooks:
|
||||
```
|
||||
|
||||
The load tester can run arbitrary commands as long as the binary is present in the container image.
|
||||
For example if you you want to replace `hey` with another CLI, you can create your own Docker image:
|
||||
For example if you want to replace `hey` with another CLI, you can create your own Docker image:
|
||||
|
||||
```dockerfile
|
||||
```text
|
||||
FROM weaveworks/flagger-loadtester:<VER>
|
||||
|
||||
RUN curl -Lo /usr/local/bin/my-cli https://github.com/user/repo/releases/download/ver/my-cli \
|
||||
&& chmod +x /usr/local/bin/my-cli
|
||||
```
|
||||
|
||||
### Load Testing Delegation
|
||||
## Load Testing Delegation
|
||||
|
||||
The load tester can also forward testing tasks to external tools, by now [nGrinder](https://github.com/naver/ngrinder)
|
||||
is supported.
|
||||
The load tester can also forward testing tasks to external tools,
|
||||
by now [nGrinder](https://github.com/naver/ngrinder) is supported.
|
||||
|
||||
To use this feature, add a load test task of type 'ngrinder' to the canary analysis spec:
|
||||
|
||||
@@ -225,11 +246,14 @@ webhooks:
|
||||
# the interval between between nGrinder test status polling, default to 1s
|
||||
pollInterval: 5s
|
||||
```
|
||||
When the canary analysis starts, the load tester will initiate a [clone_and_start request](https://github.com/naver/ngrinder/wiki/REST-API-PerfTest)
|
||||
to the nGrinder server and start a new performance test. the load tester will periodically poll the nGrinder server
|
||||
for the status of the test, and prevent duplicate requests from being sent in subsequent analysis loops.
|
||||
|
||||
### Integration Testing
|
||||
When the canary analysis starts, the load tester will initiate a
|
||||
[clone_and_start request](https://github.com/naver/ngrinder/wiki/REST-API-PerfTest)
|
||||
to the nGrinder server and start a new performance test. the load tester will periodically
|
||||
poll the nGrinder server for the status of the test,
|
||||
and prevent duplicate requests from being sent in subsequent analysis loops.
|
||||
|
||||
## Integration Testing
|
||||
|
||||
Flagger comes with a testing service that can run Helm tests, Bats tests or Concord tests when configured as a webhook.
|
||||
|
||||
@@ -243,7 +267,7 @@ helm upgrade -i flagger-helmtester flagger/loadtester \
|
||||
--set serviceAccountName=tiller
|
||||
```
|
||||
|
||||
When deployed the Helm tester API will be available at `http://flagger-helmtester.kube-system/`.
|
||||
When deployed the Helm tester API will be available at `http://flagger-helmtester.kube-system/`.
|
||||
|
||||
Now you can add pre-rollout webhooks to the canary analysis spec:
|
||||
|
||||
@@ -262,7 +286,8 @@ Now you can add pre-rollout webhooks to the canary analysis spec:
|
||||
When the canary analysis starts, Flagger will call the pre-rollout webhooks before routing traffic to the canary.
|
||||
If the helm test fails, Flagger will retry until the analysis threshold is reached and the canary is rolled back.
|
||||
|
||||
If you are using Helm v3, you'll have to create a dedicated service account and add the release namespace to the test command:
|
||||
If you are using Helm v3,
|
||||
you'll have to create a dedicated service account and add the release namespace to the test command:
|
||||
|
||||
```yaml
|
||||
analysis:
|
||||
@@ -277,9 +302,10 @@ If you are using Helm v3, you'll have to create a dedicated service account and
|
||||
```
|
||||
|
||||
If the test hangs or logs error messages hinting to insufficient permissions it can be related to RBAC,
|
||||
check the [Troubleshooting](#Troubleshooting) section for an example configuration.
|
||||
check the [Troubleshooting](webhooks.md#Troubleshooting) section for an example configuration.
|
||||
|
||||
As an alternative to Helm you can use the [Bash Automated Testing System](https://github.com/bats-core/bats-core) to run your tests.
|
||||
As an alternative to Helm you can use the
|
||||
[Bash Automated Testing System](https://github.com/bats-core/bats-core) to run your tests.
|
||||
|
||||
```yaml
|
||||
analysis:
|
||||
@@ -316,21 +342,25 @@ You can also configure the test runner to start a [Concord](https://concord.walm
|
||||
pollTimeout: "60"
|
||||
```
|
||||
|
||||
`org`, `project`, `repo` and `entrypoint` represents where your test process runs in Concord.
|
||||
In order to authenticate to Concord, you need to set `apiKeyPath` to a path of a file containing a valid Concord API key
|
||||
on the `flagger-helmtester` container. This can be done via mounting a Kubernetes secret in the tester's Deployment.
|
||||
`pollInterval` represents the interval in seconds the web-hook will call Concord to see if the process has finished (Default is 5s).
|
||||
`pollTimeout` represents the time in seconds the web-hook will try to call Concord before timing out (Default is 30s).
|
||||
`org`, `project`, `repo` and `entrypoint` represents where your test process runs in Concord.
|
||||
In order to authenticate to Concord, you need to set `apiKeyPath`
|
||||
to a path of a file containing a valid Concord API key on the `flagger-helmtester` container.
|
||||
This can be done via mounting a Kubernetes secret in the tester's Deployment.
|
||||
`pollInterval` represents the interval in seconds the web-hook will call Concord
|
||||
to see if the process has finished (Default is 5s). `pollTimeout` represents the time in seconds
|
||||
the web-hook will try to call Concord before timing out (Default is 30s).
|
||||
|
||||
### Manual Gating
|
||||
## Manual Gating
|
||||
|
||||
For manual approval of a canary deployment you can use the `confirm-rollout` and `confirm-promotion` webhooks.
|
||||
The confirmation rollout hooks are executed before the pre-rollout hooks.
|
||||
For manual approval of a canary deployment you can use the `confirm-rollout` and `confirm-promotion` webhooks.
|
||||
The confirmation rollout hooks are executed before the pre-rollout hooks. For manually approving traffic weight increase,
|
||||
you can use the `confirm-traffic-increase` webhook.
|
||||
Flagger will halt the canary traffic shifting and analysis until the confirm webhook returns HTTP status 200.
|
||||
|
||||
For manual rollback of a canary deployment you can use the `rollback` webhook. The rollback hook will be called
|
||||
during the analysis and confirmation states. If a rollback webhook returns a successful HTTP status code, Flagger
|
||||
will shift all traffic back to the primary instance and fail the canary.
|
||||
For manual rollback of a canary deployment you can use the `rollback` webhook.
|
||||
The rollback hook will be called during the analysis and confirmation states.
|
||||
If a rollback webhook returns a successful HTTP status code,
|
||||
Flagger will shift all traffic back to the primary instance and fail the canary.
|
||||
|
||||
Manual gating with Flagger's tester:
|
||||
|
||||
@@ -342,9 +372,21 @@ Manual gating with Flagger's tester:
|
||||
url: http://flagger-loadtester.test/gate/halt
|
||||
```
|
||||
|
||||
The `/gate/halt` returns HTTP 403 thus blocking the rollout.
|
||||
The `/gate/halt` returns HTTP 403 thus blocking the rollout.
|
||||
|
||||
If you have notifications enabled, Flagger will post a message to Slack or MS Teams if a canary rollout is waiting for approval.
|
||||
If you have notifications enabled, Flagger will post a message to
|
||||
Slack or MS Teams if a canary rollout is waiting for approval.
|
||||
|
||||
The notifications can be disabled with:
|
||||
|
||||
```yaml
|
||||
analysis:
|
||||
webhooks:
|
||||
- name: "gate"
|
||||
type: confirm-rollout
|
||||
url: http://flagger-loadtester.test/gate/halt
|
||||
muteAlert: true
|
||||
```
|
||||
|
||||
Change the URL to `/gate/approve` to start the canary analysis:
|
||||
|
||||
@@ -371,13 +413,13 @@ By default the gate is closed, you can start or resume the canary rollout with:
|
||||
```bash
|
||||
kubectl -n test exec -it flagger-loadtester-xxxx-xxxx sh
|
||||
|
||||
curl -d '{"name": "podinfo","namespace":"test"}' http://localhost:8080/gate/open
|
||||
curl -d '{"name": "podinfo","namespace":"test"}' http://localhost:8080/gate/open
|
||||
```
|
||||
|
||||
You can pause the rollout at any time with:
|
||||
|
||||
```bash
|
||||
curl -d '{"name": "podinfo","namespace":"test"}' http://localhost:8080/gate/close
|
||||
curl -d '{"name": "podinfo","namespace":"test"}' http://localhost:8080/gate/close
|
||||
```
|
||||
|
||||
If a canary analysis is paused the status will change to waiting:
|
||||
@@ -400,8 +442,8 @@ While the promotion is paused, Flagger will continue to run the metrics checks a
|
||||
url: http://flagger-loadtester.test/gate/halt
|
||||
```
|
||||
|
||||
The `rollback` hook type can be used to manually rollback the canary promotion. As with gating, rollbacks can be driven
|
||||
with Flagger's tester API by setting the rollback URL to `/rollback/check`
|
||||
The `rollback` hook type can be used to manually rollback the canary promotion.
|
||||
As with gating, rollbacks can be driven with Flagger's tester API by setting the rollback URL to `/rollback/check`
|
||||
|
||||
```yaml
|
||||
analysis:
|
||||
@@ -409,35 +451,36 @@ with Flagger's tester API by setting the rollback URL to `/rollback/check`
|
||||
- name: "rollback"
|
||||
type: rollback
|
||||
url: http://flagger-loadtester.test/rollback/check
|
||||
```
|
||||
```
|
||||
|
||||
By default rollback is closed, you can rollback a canary rollout with:
|
||||
By default, rollback is closed, you can rollback a canary rollout with:
|
||||
|
||||
```bash
|
||||
kubectl -n test exec -it flagger-loadtester-xxxx-xxxx sh
|
||||
|
||||
curl -d '{"name": "podinfo","namespace":"test"}' http://localhost:8080/rollback/open
|
||||
curl -d '{"name": "podinfo","namespace":"test"}' http://localhost:8080/rollback/open
|
||||
```
|
||||
|
||||
You can close the rollback with:
|
||||
|
||||
```bash
|
||||
curl -d '{"name": "podinfo","namespace":"test"}' http://localhost:8080/rollback/close
|
||||
curl -d '{"name": "podinfo","namespace":"test"}' http://localhost:8080/rollback/close
|
||||
```
|
||||
|
||||
If you have notifications enabled, Flagger will post a message to Slack or MS Teams if a canary has been rolled back.
|
||||
|
||||
### Troubleshooting
|
||||
## Troubleshooting
|
||||
|
||||
#### Manually check if helm test is running
|
||||
### Manually check if helm test is running
|
||||
|
||||
To debug in depth any issues with helm tests, you can execute commands on the flagger-loadtester pod.
|
||||
|
||||
```bash
|
||||
kubectl exec -it deploy/flagger-loadtester -- bash
|
||||
helmv3 test <release> -n <namespace> --debug
|
||||
```
|
||||
|
||||
#### Helm tests hang during canary deployment
|
||||
### Helm tests hang during canary deployment
|
||||
|
||||
If test execution hangs or displays insufficient permissions, check your RBAC settings.
|
||||
|
||||
|
||||
28
docs/logo/flagger-icon-black.svg
Normal file
@@ -0,0 +1,28 @@
|
||||
<?xml version="1.0" encoding="UTF-8"?>
|
||||
<svg width="64px" height="64px" viewBox="0 0 64 64" version="1.1" xmlns="http://www.w3.org/2000/svg" xmlns:xlink="http://www.w3.org/1999/xlink">
|
||||
<title>flagger-icon-black</title>
|
||||
<g id="flagger-icon-black" stroke="none" stroke-width="1" fill="none" fill-rule="evenodd">
|
||||
<path d="M11.7870673,17.7791346 C10.7376442,17.0966346 10.7376442,15.5602885 11.7870673,14.8783654 L31.1659135,2.27951923 C31.4527085,2.09313128 31.7809164,2 32.109115,2 C32.1144833,2 32.1144833,30.6577081 32.1144833,30.6577081 C31.7844966,30.658555 31.4542722,30.565385 31.1659135,30.3779808 L11.7870673,17.7791346 Z" id="Fill-1" fill="#000000"></path>
|
||||
<path d="M1.78706731,24.2791346 C0.737644231,23.5966346 0.737644231,22.0602885 1.78706731,21.3783654 L21.1659135,8.77951923 C21.4527085,8.59313128 21.7809164,8.5 22.109147,8.5 C22.1144833,8.5 16.7504591,14.9302441 16.4621003,14.7428399 L1.78706731,24.2791346 Z" id="Fill-1-Copy" fill="#000000"></path>
|
||||
<path d="M32.1005414,32.7999243 C32.4314477,32.7984255 32.7627112,32.8915919 33.051875,33.0795192 L52.4312981,45.6783654 C53.4807212,46.3602885 53.4807212,47.8966346 52.4312981,48.5791346 L33.051875,61.1779808 C32.7723427,61.3596486 32.4534685,61.452763 32.1336066,61.4575 C32.1336066,61.4575 32.1005414,32.7999243 32.1005414,32.7999243 Z" id="Fill-1" fill="#000000"></path>
|
||||
<path d="M42.6594534,51.6821881 L62.4312981,39.1784411 C63.4807212,39.8603641 63.4807212,41.3967103 62.4312981,42.0792103 L43.051875,54.6780564 C42.7723427,54.8597243 42.4534685,54.9528387 42.1336066,54.9573995 C42.1336066,54.9573995 42.3702896,51.4942608 42.6594534,51.6821881 Z" id="Fill-1-Copy-2" fill="#000000"></path>
|
||||
<g id="Group" transform="translate(11.000000, 32.000000)" fill="#000000">
|
||||
<path d="M23.1648462,1.79890385 C22.7177486,1.57560653 21.9079818,0.775616463 21.12525,0.8 C20.4471662,0.8 20.1819808,1.07951923 19.08525,1.79890385 C20.6106346,2.45198077 26.2588846,4.40082692 27.8390769,4.83755769 C25.3252832,3.17403545 23.7672062,2.16115083 23.1648462,1.79890385 Z" id="Fill-5"></path>
|
||||
<path d="M17.1629423,3.04898077 L15.4269808,4.17744231 C16.9371113,5.2881491 18.4473527,6.15609036 19.9577051,6.7812661 C23.0272183,8.05182074 26.9292047,8.86995809 27.8191154,9.08936538 C32.8706538,10.3349423 37.6418077,11.5107115 41.4783462,15.3478269 C41.6733462,15.54225 41.8562308,15.7407115 42.0373846,15.93975 C42.4308462,15.1880192 42.2335385,14.1957115 41.4466154,13.6845577 L33.8560385,8.74898077 C32.0133462,8.14090385 30.1360385,7.67590385 28.2806538,7.21898077 C26.5308462,6.78744231 23.5727919,6.02059898 21.9181765,5.49156052 C20.8150996,5.13886821 19.2300215,4.32467496 17.1629423,3.04898077 Z" id="Fill-7"></path>
|
||||
<path d="M16.8750849,8.20483098 C15.6193488,7.62821266 14.2831279,6.83594208 12.8664221,5.82801923 L11.2119808,6.91782692 C12.8335577,8.16072333 14.2385577,9.07106402 15.4269808,9.648849 C17.2096154,10.5155265 24.0114808,12.3722308 24.4326346,12.4760769 C29.4841731,13.7210769 34.2553269,14.8968462 38.0924423,18.7339615 C38.0987885,18.7408846 38.1045577,18.7472308 38.1114808,18.7541538 L39.75225,17.6868462 C39.6524423,17.5824231 39.5584038,17.4751154 39.4545577,17.3718462 C35.2384038,13.1551154 29.9791731,11.8587692 24.8941731,10.6051154 C24.3137885,10.4620385 18.7586891,9.06975845 16.8750849,8.20483098 Z" id="Fill-11"></path>
|
||||
<path d="M23.1650769,16.3935 C27.1175769,17.4140769 30.8341154,18.6342692 33.9823846,21.4381154 L35.6439231,20.3581154 C32.0465509,16.9762696 28.005918,15.3433009 23.4551919,14.4789663 C19.3757148,13.7041376 16.6984434,12.7436057 13.6520967,11.5324737 C11.621199,10.7250524 9.97648083,9.72718297 8.71794231,8.53886538 L7.04717308,9.62521154 C9.06194661,11.3700006 10.8411363,12.5664934 12.3847422,13.2146899 C14.4228927,14.0705575 18.0163376,15.1301608 23.1650769,16.3935 Z" id="Fill-17"></path>
|
||||
<path d="M4.57875,11.2299231 L2.92990385,12.3018462 C2.98759615,12.3612692 3.04009615,12.423 3.09951923,12.4818462 C7.31625,16.6985769 12.5743269,17.9949231 17.6599038,19.2485769 C22.0641346,20.3337692 26.2543269,21.3687692 29.7989423,24.1581923 L31.4893269,23.0591538 C27.4958654,19.6968462 22.7385577,18.5158846 18.1214423,17.3781923 C13.1206731,16.1453077 8.39567308,14.9758846 4.57875,11.2299231" id="Fill-19"></path>
|
||||
<path d="M1.07555769,14.5060962 C0.883442308,14.3139808 0.702865385,14.1184038 0.524019231,13.9216731 C-0.227711538,14.6745577 -0.139442308,15.9726346 0.80325,16.5853269 L6.50959615,20.2955192 C9.03536538,21.3409038 11.6765192,21.9945577 14.2738269,22.6349423 C18.3284423,23.6341731 22.2019038,24.5924423 25.5578654,26.9157115 L27.2834423,25.7930192 C23.4676731,22.9245577 19.0403654,21.8255192 14.7347885,20.7639808 C9.68382692,19.5189808 4.91267308,18.3432115 1.07555769,14.5060962" id="Fill-21"></path>
|
||||
<path d="M19.6441154,28.8342692 C20.0243077,29.0188846 20.3998846,29.2133077 20.7691154,29.4221538 C21.2093077,29.5150385 21.6771923,29.4383077 22.0683462,29.1838846 L23.0260385,28.5613846 C19.9493077,26.5035 16.5287308,25.461 13.1196923,24.5927308 L19.6441154,28.8342692 Z" id="Fill-23"></path>
|
||||
</g>
|
||||
<g id="Group-Copy" transform="translate(11.000000, 1.200000)" fill="#000000">
|
||||
<path d="M23.1648462,1.79890385 C22.7177486,1.57560653 21.9079818,0.775616463 21.12525,0.8 C20.4471662,0.8 20.1819808,1.07951923 19.08525,1.79890385 C20.6106346,2.45198077 26.2588846,4.40082692 27.8390769,4.83755769 C25.3252832,3.17403545 23.7672062,2.16115083 23.1648462,1.79890385 Z" id="Fill-5"></path>
|
||||
<path d="M17.1629423,3.04898077 L15.4269808,4.17744231 C16.9371113,5.2881491 18.4473527,6.15609036 19.9577051,6.7812661 C23.0272183,8.05182074 26.9292047,8.86995809 27.8191154,9.08936538 C32.8706538,10.3349423 37.6418077,11.5107115 41.4783462,15.3478269 C41.6733462,15.54225 41.8562308,15.7407115 42.0373846,15.93975 C42.4308462,15.1880192 42.2335385,14.1957115 41.4466154,13.6845577 L33.8560385,8.74898077 C32.0133462,8.14090385 30.1360385,7.67590385 28.2806538,7.21898077 C26.5308462,6.78744231 23.5727919,6.02059898 21.9181765,5.49156052 C20.8150996,5.13886821 19.2300215,4.32467496 17.1629423,3.04898077 Z" id="Fill-7"></path>
|
||||
<path d="M16.8750849,8.20483098 C15.6193488,7.62821266 14.2831279,6.83594208 12.8664221,5.82801923 L11.2119808,6.91782692 C12.8335577,8.16072333 14.2385577,9.07106402 15.4269808,9.648849 C17.2096154,10.5155265 24.0114808,12.3722308 24.4326346,12.4760769 C29.4841731,13.7210769 34.2553269,14.8968462 38.0924423,18.7339615 C38.0987885,18.7408846 38.1045577,18.7472308 38.1114808,18.7541538 L39.75225,17.6868462 C39.6524423,17.5824231 39.5584038,17.4751154 39.4545577,17.3718462 C35.2384038,13.1551154 29.9791731,11.8587692 24.8941731,10.6051154 C24.3137885,10.4620385 18.7586891,9.06975845 16.8750849,8.20483098 Z" id="Fill-11"></path>
|
||||
<path d="M23.1650769,16.3935 C27.1175769,17.4140769 30.8341154,18.6342692 33.9823846,21.4381154 L35.6439231,20.3581154 C32.0465509,16.9762696 28.005918,15.3433009 23.4551919,14.4789663 C19.3757148,13.7041376 16.6984434,12.7436057 13.6520967,11.5324737 C11.621199,10.7250524 9.97648083,9.72718297 8.71794231,8.53886538 L7.04717308,9.62521154 C9.06194661,11.3700006 10.8411363,12.5664934 12.3847422,13.2146899 C14.4228927,14.0705575 18.0163376,15.1301608 23.1650769,16.3935 Z" id="Fill-17"></path>
|
||||
<path d="M4.57875,11.2299231 L2.92990385,12.3018462 C2.98759615,12.3612692 3.04009615,12.423 3.09951923,12.4818462 C7.31625,16.6985769 12.5743269,17.9949231 17.6599038,19.2485769 C22.0641346,20.3337692 26.2543269,21.3687692 29.7989423,24.1581923 L31.4893269,23.0591538 C27.4958654,19.6968462 22.7385577,18.5158846 18.1214423,17.3781923 C13.1206731,16.1453077 8.39567308,14.9758846 4.57875,11.2299231" id="Fill-19"></path>
|
||||
<path d="M1.07555769,14.5060962 C0.883442308,14.3139808 0.702865385,14.1184038 0.524019231,13.9216731 C-0.227711538,14.6745577 -0.139442308,15.9726346 0.80325,16.5853269 L6.50959615,20.2955192 C9.03536538,21.3409038 11.6765192,21.9945577 14.2738269,22.6349423 C18.3284423,23.6341731 22.2019038,24.5924423 25.5578654,26.9157115 L27.2834423,25.7930192 C23.4676731,22.9245577 19.0403654,21.8255192 14.7347885,20.7639808 C9.68382692,19.5189808 4.91267308,18.3432115 1.07555769,14.5060962" id="Fill-21"></path>
|
||||
<path d="M19.6441154,28.8342692 C20.0243077,29.0188846 20.3998846,29.2133077 20.7691154,29.4221538 C21.2093077,29.5150385 21.6771923,29.4383077 22.0683462,29.1838846 L23.0260385,28.5613846 C19.9493077,26.5035 16.5287308,25.461 13.1196923,24.5927308 L19.6441154,28.8342692 Z" id="Fill-23"></path>
|
||||
</g>
|
||||
</g>
|
||||
</svg>
|
||||
|
After Width: | Height: | Size: 8.5 KiB |
BIN
docs/logo/flagger-icon-black@2x.png
Normal file
|
After Width: | Height: | Size: 4.2 KiB |
28
docs/logo/flagger-icon-color.svg
Normal file
@@ -0,0 +1,28 @@
|
||||
<?xml version="1.0" encoding="UTF-8"?>
|
||||
<svg width="64px" height="64px" viewBox="0 0 64 64" version="1.1" xmlns="http://www.w3.org/2000/svg" xmlns:xlink="http://www.w3.org/1999/xlink">
|
||||
<title>flagger-icon</title>
|
||||
<g id="flagger-icon" stroke="none" stroke-width="1" fill="none" fill-rule="evenodd">
|
||||
<path d="M11.7870673,17.7791346 C10.7376442,17.0966346 10.7376442,15.5602885 11.7870673,14.8783654 L31.1659135,2.27951923 C31.4527085,2.09313128 31.7809164,2 32.109115,2 C32.1144833,2 32.1144833,30.6577081 32.1144833,30.6577081 C31.7844966,30.658555 31.4542722,30.565385 31.1659135,30.3779808 L11.7870673,17.7791346 Z" id="Fill-1" fill="#7BB09F"></path>
|
||||
<path d="M1.78706731,24.2791346 C0.737644231,23.5966346 0.737644231,22.0602885 1.78706731,21.3783654 L21.1659135,8.77951923 C21.4527085,8.59313128 21.7809164,8.5 22.109147,8.5 C22.1144833,8.5 16.7504591,14.9302441 16.4621003,14.7428399 L1.78706731,24.2791346 Z" id="Fill-1-Copy" fill="#7BB09F"></path>
|
||||
<path d="M32.1005414,32.7999243 C32.4314477,32.7984255 32.7627112,32.8915919 33.051875,33.0795192 L52.4312981,45.6783654 C53.4807212,46.3602885 53.4807212,47.8966346 52.4312981,48.5791346 L33.051875,61.1779808 C32.7723427,61.3596486 32.4534685,61.452763 32.1336066,61.4575 C32.1336066,61.4575 32.1005414,32.7999243 32.1005414,32.7999243 Z" id="Fill-1" fill="#7BB09F"></path>
|
||||
<path d="M42.6594534,51.6821881 L62.4312981,39.1784411 C63.4807212,39.8603641 63.4807212,41.3967103 62.4312981,42.0792103 L43.051875,54.6780564 C42.7723427,54.8597243 42.4534685,54.9528387 42.1336066,54.9573995 C42.1336066,54.9573995 42.3702896,51.4942608 42.6594534,51.6821881 Z" id="Fill-1-Copy-2" fill="#7BB09F"></path>
|
||||
<g id="Group" transform="translate(11.000000, 32.000000)" fill="#7BB09F">
|
||||
<path d="M23.1648462,1.79890385 C22.7177486,1.57560653 21.9079818,0.775616463 21.12525,0.8 C20.4471662,0.8 20.1819808,1.07951923 19.08525,1.79890385 C20.6106346,2.45198077 26.2588846,4.40082692 27.8390769,4.83755769 C25.3252832,3.17403545 23.7672062,2.16115083 23.1648462,1.79890385 Z" id="Fill-5"></path>
|
||||
<path d="M17.1629423,3.04898077 L15.4269808,4.17744231 C16.9371113,5.2881491 18.4473527,6.15609036 19.9577051,6.7812661 C23.0272183,8.05182074 26.9292047,8.86995809 27.8191154,9.08936538 C32.8706538,10.3349423 37.6418077,11.5107115 41.4783462,15.3478269 C41.6733462,15.54225 41.8562308,15.7407115 42.0373846,15.93975 C42.4308462,15.1880192 42.2335385,14.1957115 41.4466154,13.6845577 L33.8560385,8.74898077 C32.0133462,8.14090385 30.1360385,7.67590385 28.2806538,7.21898077 C26.5308462,6.78744231 23.5727919,6.02059898 21.9181765,5.49156052 C20.8150996,5.13886821 19.2300215,4.32467496 17.1629423,3.04898077 Z" id="Fill-7"></path>
|
||||
<path d="M16.8750849,8.20483098 C15.6193488,7.62821266 14.2831279,6.83594208 12.8664221,5.82801923 L11.2119808,6.91782692 C12.8335577,8.16072333 14.2385577,9.07106402 15.4269808,9.648849 C17.2096154,10.5155265 24.0114808,12.3722308 24.4326346,12.4760769 C29.4841731,13.7210769 34.2553269,14.8968462 38.0924423,18.7339615 C38.0987885,18.7408846 38.1045577,18.7472308 38.1114808,18.7541538 L39.75225,17.6868462 C39.6524423,17.5824231 39.5584038,17.4751154 39.4545577,17.3718462 C35.2384038,13.1551154 29.9791731,11.8587692 24.8941731,10.6051154 C24.3137885,10.4620385 18.7586891,9.06975845 16.8750849,8.20483098 Z" id="Fill-11"></path>
|
||||
<path d="M23.1650769,16.3935 C27.1175769,17.4140769 30.8341154,18.6342692 33.9823846,21.4381154 L35.6439231,20.3581154 C32.0465509,16.9762696 28.005918,15.3433009 23.4551919,14.4789663 C19.3757148,13.7041376 16.6984434,12.7436057 13.6520967,11.5324737 C11.621199,10.7250524 9.97648083,9.72718297 8.71794231,8.53886538 L7.04717308,9.62521154 C9.06194661,11.3700006 10.8411363,12.5664934 12.3847422,13.2146899 C14.4228927,14.0705575 18.0163376,15.1301608 23.1650769,16.3935 Z" id="Fill-17"></path>
|
||||
<path d="M4.57875,11.2299231 L2.92990385,12.3018462 C2.98759615,12.3612692 3.04009615,12.423 3.09951923,12.4818462 C7.31625,16.6985769 12.5743269,17.9949231 17.6599038,19.2485769 C22.0641346,20.3337692 26.2543269,21.3687692 29.7989423,24.1581923 L31.4893269,23.0591538 C27.4958654,19.6968462 22.7385577,18.5158846 18.1214423,17.3781923 C13.1206731,16.1453077 8.39567308,14.9758846 4.57875,11.2299231" id="Fill-19"></path>
|
||||
<path d="M1.07555769,14.5060962 C0.883442308,14.3139808 0.702865385,14.1184038 0.524019231,13.9216731 C-0.227711538,14.6745577 -0.139442308,15.9726346 0.80325,16.5853269 L6.50959615,20.2955192 C9.03536538,21.3409038 11.6765192,21.9945577 14.2738269,22.6349423 C18.3284423,23.6341731 22.2019038,24.5924423 25.5578654,26.9157115 L27.2834423,25.7930192 C23.4676731,22.9245577 19.0403654,21.8255192 14.7347885,20.7639808 C9.68382692,19.5189808 4.91267308,18.3432115 1.07555769,14.5060962" id="Fill-21"></path>
|
||||
<path d="M19.6441154,28.8342692 C20.0243077,29.0188846 20.3998846,29.2133077 20.7691154,29.4221538 C21.2093077,29.5150385 21.6771923,29.4383077 22.0683462,29.1838846 L23.0260385,28.5613846 C19.9493077,26.5035 16.5287308,25.461 13.1196923,24.5927308 L19.6441154,28.8342692 Z" id="Fill-23"></path>
|
||||
</g>
|
||||
<g id="Group-Copy" transform="translate(11.000000, 1.200000)" fill="#7BB09F">
|
||||
<path d="M23.1648462,1.79890385 C22.7177486,1.57560653 21.9079818,0.775616463 21.12525,0.8 C20.4471662,0.8 20.1819808,1.07951923 19.08525,1.79890385 C20.6106346,2.45198077 26.2588846,4.40082692 27.8390769,4.83755769 C25.3252832,3.17403545 23.7672062,2.16115083 23.1648462,1.79890385 Z" id="Fill-5"></path>
|
||||
<path d="M17.1629423,3.04898077 L15.4269808,4.17744231 C16.9371113,5.2881491 18.4473527,6.15609036 19.9577051,6.7812661 C23.0272183,8.05182074 26.9292047,8.86995809 27.8191154,9.08936538 C32.8706538,10.3349423 37.6418077,11.5107115 41.4783462,15.3478269 C41.6733462,15.54225 41.8562308,15.7407115 42.0373846,15.93975 C42.4308462,15.1880192 42.2335385,14.1957115 41.4466154,13.6845577 L33.8560385,8.74898077 C32.0133462,8.14090385 30.1360385,7.67590385 28.2806538,7.21898077 C26.5308462,6.78744231 23.5727919,6.02059898 21.9181765,5.49156052 C20.8150996,5.13886821 19.2300215,4.32467496 17.1629423,3.04898077 Z" id="Fill-7"></path>
|
||||
<path d="M16.8750849,8.20483098 C15.6193488,7.62821266 14.2831279,6.83594208 12.8664221,5.82801923 L11.2119808,6.91782692 C12.8335577,8.16072333 14.2385577,9.07106402 15.4269808,9.648849 C17.2096154,10.5155265 24.0114808,12.3722308 24.4326346,12.4760769 C29.4841731,13.7210769 34.2553269,14.8968462 38.0924423,18.7339615 C38.0987885,18.7408846 38.1045577,18.7472308 38.1114808,18.7541538 L39.75225,17.6868462 C39.6524423,17.5824231 39.5584038,17.4751154 39.4545577,17.3718462 C35.2384038,13.1551154 29.9791731,11.8587692 24.8941731,10.6051154 C24.3137885,10.4620385 18.7586891,9.06975845 16.8750849,8.20483098 Z" id="Fill-11"></path>
|
||||
<path d="M23.1650769,16.3935 C27.1175769,17.4140769 30.8341154,18.6342692 33.9823846,21.4381154 L35.6439231,20.3581154 C32.0465509,16.9762696 28.005918,15.3433009 23.4551919,14.4789663 C19.3757148,13.7041376 16.6984434,12.7436057 13.6520967,11.5324737 C11.621199,10.7250524 9.97648083,9.72718297 8.71794231,8.53886538 L7.04717308,9.62521154 C9.06194661,11.3700006 10.8411363,12.5664934 12.3847422,13.2146899 C14.4228927,14.0705575 18.0163376,15.1301608 23.1650769,16.3935 Z" id="Fill-17"></path>
|
||||
<path d="M4.57875,11.2299231 L2.92990385,12.3018462 C2.98759615,12.3612692 3.04009615,12.423 3.09951923,12.4818462 C7.31625,16.6985769 12.5743269,17.9949231 17.6599038,19.2485769 C22.0641346,20.3337692 26.2543269,21.3687692 29.7989423,24.1581923 L31.4893269,23.0591538 C27.4958654,19.6968462 22.7385577,18.5158846 18.1214423,17.3781923 C13.1206731,16.1453077 8.39567308,14.9758846 4.57875,11.2299231" id="Fill-19"></path>
|
||||
<path d="M1.07555769,14.5060962 C0.883442308,14.3139808 0.702865385,14.1184038 0.524019231,13.9216731 C-0.227711538,14.6745577 -0.139442308,15.9726346 0.80325,16.5853269 L6.50959615,20.2955192 C9.03536538,21.3409038 11.6765192,21.9945577 14.2738269,22.6349423 C18.3284423,23.6341731 22.2019038,24.5924423 25.5578654,26.9157115 L27.2834423,25.7930192 C23.4676731,22.9245577 19.0403654,21.8255192 14.7347885,20.7639808 C9.68382692,19.5189808 4.91267308,18.3432115 1.07555769,14.5060962" id="Fill-21"></path>
|
||||
<path d="M19.6441154,28.8342692 C20.0243077,29.0188846 20.3998846,29.2133077 20.7691154,29.4221538 C21.2093077,29.5150385 21.6771923,29.4383077 22.0683462,29.1838846 L23.0260385,28.5613846 C19.9493077,26.5035 16.5287308,25.461 13.1196923,24.5927308 L19.6441154,28.8342692 Z" id="Fill-23"></path>
|
||||
</g>
|
||||
</g>
|
||||
</svg>
|
||||
|
After Width: | Height: | Size: 8.4 KiB |
BIN
docs/logo/flagger-icon-color@2x.png
Normal file
|
After Width: | Height: | Size: 7.5 KiB |
28
docs/logo/flagger-icon-white.svg
Normal file
@@ -0,0 +1,28 @@
|
||||
<?xml version="1.0" encoding="UTF-8"?>
|
||||
<svg width="64px" height="64px" viewBox="0 0 64 64" version="1.1" xmlns="http://www.w3.org/2000/svg" xmlns:xlink="http://www.w3.org/1999/xlink">
|
||||
<title>flagger-icon-white</title>
|
||||
<g id="flagger-icon-white" stroke="none" stroke-width="1" fill="none" fill-rule="evenodd">
|
||||
<path d="M11.7870673,17.7791346 C10.7376442,17.0966346 10.7376442,15.5602885 11.7870673,14.8783654 L31.1659135,2.27951923 C31.4527085,2.09313128 31.7809164,2 32.109115,2 C32.1144833,2 32.1144833,30.6577081 32.1144833,30.6577081 C31.7844966,30.658555 31.4542722,30.565385 31.1659135,30.3779808 L11.7870673,17.7791346 Z" id="Fill-1" fill="#FFFFFF"></path>
|
||||
<path d="M1.78706731,24.2791346 C0.737644231,23.5966346 0.737644231,22.0602885 1.78706731,21.3783654 L21.1659135,8.77951923 C21.4527085,8.59313128 21.7809164,8.5 22.109147,8.5 C22.1144833,8.5 16.7504591,14.9302441 16.4621003,14.7428399 L1.78706731,24.2791346 Z" id="Fill-1-Copy" fill="#FFFFFF"></path>
|
||||
<path d="M32.1005414,32.7999243 C32.4314477,32.7984255 32.7627112,32.8915919 33.051875,33.0795192 L52.4312981,45.6783654 C53.4807212,46.3602885 53.4807212,47.8966346 52.4312981,48.5791346 L33.051875,61.1779808 C32.7723427,61.3596486 32.4534685,61.452763 32.1336066,61.4575 C32.1336066,61.4575 32.1005414,32.7999243 32.1005414,32.7999243 Z" id="Fill-1" fill="#FFFFFF"></path>
|
||||
<path d="M42.6594534,51.6821881 L62.4312981,39.1784411 C63.4807212,39.8603641 63.4807212,41.3967103 62.4312981,42.0792103 L43.051875,54.6780564 C42.7723427,54.8597243 42.4534685,54.9528387 42.1336066,54.9573995 C42.1336066,54.9573995 42.3702896,51.4942608 42.6594534,51.6821881 Z" id="Fill-1-Copy-2" fill="#FFFFFF"></path>
|
||||
<g id="Group" transform="translate(11.000000, 32.000000)" fill="#FFFFFF">
|
||||
<path d="M23.1648462,1.79890385 C22.7177486,1.57560653 21.9079818,0.775616463 21.12525,0.8 C20.4471662,0.8 20.1819808,1.07951923 19.08525,1.79890385 C20.6106346,2.45198077 26.2588846,4.40082692 27.8390769,4.83755769 C25.3252832,3.17403545 23.7672062,2.16115083 23.1648462,1.79890385 Z" id="Fill-5"></path>
|
||||
<path d="M17.1629423,3.04898077 L15.4269808,4.17744231 C16.9371113,5.2881491 18.4473527,6.15609036 19.9577051,6.7812661 C23.0272183,8.05182074 26.9292047,8.86995809 27.8191154,9.08936538 C32.8706538,10.3349423 37.6418077,11.5107115 41.4783462,15.3478269 C41.6733462,15.54225 41.8562308,15.7407115 42.0373846,15.93975 C42.4308462,15.1880192 42.2335385,14.1957115 41.4466154,13.6845577 L33.8560385,8.74898077 C32.0133462,8.14090385 30.1360385,7.67590385 28.2806538,7.21898077 C26.5308462,6.78744231 23.5727919,6.02059898 21.9181765,5.49156052 C20.8150996,5.13886821 19.2300215,4.32467496 17.1629423,3.04898077 Z" id="Fill-7"></path>
|
||||
<path d="M16.8750849,8.20483098 C15.6193488,7.62821266 14.2831279,6.83594208 12.8664221,5.82801923 L11.2119808,6.91782692 C12.8335577,8.16072333 14.2385577,9.07106402 15.4269808,9.648849 C17.2096154,10.5155265 24.0114808,12.3722308 24.4326346,12.4760769 C29.4841731,13.7210769 34.2553269,14.8968462 38.0924423,18.7339615 C38.0987885,18.7408846 38.1045577,18.7472308 38.1114808,18.7541538 L39.75225,17.6868462 C39.6524423,17.5824231 39.5584038,17.4751154 39.4545577,17.3718462 C35.2384038,13.1551154 29.9791731,11.8587692 24.8941731,10.6051154 C24.3137885,10.4620385 18.7586891,9.06975845 16.8750849,8.20483098 Z" id="Fill-11"></path>
|
||||
<path d="M23.1650769,16.3935 C27.1175769,17.4140769 30.8341154,18.6342692 33.9823846,21.4381154 L35.6439231,20.3581154 C32.0465509,16.9762696 28.005918,15.3433009 23.4551919,14.4789663 C19.3757148,13.7041376 16.6984434,12.7436057 13.6520967,11.5324737 C11.621199,10.7250524 9.97648083,9.72718297 8.71794231,8.53886538 L7.04717308,9.62521154 C9.06194661,11.3700006 10.8411363,12.5664934 12.3847422,13.2146899 C14.4228927,14.0705575 18.0163376,15.1301608 23.1650769,16.3935 Z" id="Fill-17"></path>
|
||||
<path d="M4.57875,11.2299231 L2.92990385,12.3018462 C2.98759615,12.3612692 3.04009615,12.423 3.09951923,12.4818462 C7.31625,16.6985769 12.5743269,17.9949231 17.6599038,19.2485769 C22.0641346,20.3337692 26.2543269,21.3687692 29.7989423,24.1581923 L31.4893269,23.0591538 C27.4958654,19.6968462 22.7385577,18.5158846 18.1214423,17.3781923 C13.1206731,16.1453077 8.39567308,14.9758846 4.57875,11.2299231" id="Fill-19"></path>
|
||||
<path d="M1.07555769,14.5060962 C0.883442308,14.3139808 0.702865385,14.1184038 0.524019231,13.9216731 C-0.227711538,14.6745577 -0.139442308,15.9726346 0.80325,16.5853269 L6.50959615,20.2955192 C9.03536538,21.3409038 11.6765192,21.9945577 14.2738269,22.6349423 C18.3284423,23.6341731 22.2019038,24.5924423 25.5578654,26.9157115 L27.2834423,25.7930192 C23.4676731,22.9245577 19.0403654,21.8255192 14.7347885,20.7639808 C9.68382692,19.5189808 4.91267308,18.3432115 1.07555769,14.5060962" id="Fill-21"></path>
|
||||
<path d="M19.6441154,28.8342692 C20.0243077,29.0188846 20.3998846,29.2133077 20.7691154,29.4221538 C21.2093077,29.5150385 21.6771923,29.4383077 22.0683462,29.1838846 L23.0260385,28.5613846 C19.9493077,26.5035 16.5287308,25.461 13.1196923,24.5927308 L19.6441154,28.8342692 Z" id="Fill-23"></path>
|
||||
</g>
|
||||
<g id="Group-Copy" transform="translate(11.000000, 1.200000)" fill="#FFFFFF">
|
||||
<path d="M23.1648462,1.79890385 C22.7177486,1.57560653 21.9079818,0.775616463 21.12525,0.8 C20.4471662,0.8 20.1819808,1.07951923 19.08525,1.79890385 C20.6106346,2.45198077 26.2588846,4.40082692 27.8390769,4.83755769 C25.3252832,3.17403545 23.7672062,2.16115083 23.1648462,1.79890385 Z" id="Fill-5"></path>
|
||||
<path d="M17.1629423,3.04898077 L15.4269808,4.17744231 C16.9371113,5.2881491 18.4473527,6.15609036 19.9577051,6.7812661 C23.0272183,8.05182074 26.9292047,8.86995809 27.8191154,9.08936538 C32.8706538,10.3349423 37.6418077,11.5107115 41.4783462,15.3478269 C41.6733462,15.54225 41.8562308,15.7407115 42.0373846,15.93975 C42.4308462,15.1880192 42.2335385,14.1957115 41.4466154,13.6845577 L33.8560385,8.74898077 C32.0133462,8.14090385 30.1360385,7.67590385 28.2806538,7.21898077 C26.5308462,6.78744231 23.5727919,6.02059898 21.9181765,5.49156052 C20.8150996,5.13886821 19.2300215,4.32467496 17.1629423,3.04898077 Z" id="Fill-7"></path>
|
||||
<path d="M16.8750849,8.20483098 C15.6193488,7.62821266 14.2831279,6.83594208 12.8664221,5.82801923 L11.2119808,6.91782692 C12.8335577,8.16072333 14.2385577,9.07106402 15.4269808,9.648849 C17.2096154,10.5155265 24.0114808,12.3722308 24.4326346,12.4760769 C29.4841731,13.7210769 34.2553269,14.8968462 38.0924423,18.7339615 C38.0987885,18.7408846 38.1045577,18.7472308 38.1114808,18.7541538 L39.75225,17.6868462 C39.6524423,17.5824231 39.5584038,17.4751154 39.4545577,17.3718462 C35.2384038,13.1551154 29.9791731,11.8587692 24.8941731,10.6051154 C24.3137885,10.4620385 18.7586891,9.06975845 16.8750849,8.20483098 Z" id="Fill-11"></path>
|
||||
<path d="M23.1650769,16.3935 C27.1175769,17.4140769 30.8341154,18.6342692 33.9823846,21.4381154 L35.6439231,20.3581154 C32.0465509,16.9762696 28.005918,15.3433009 23.4551919,14.4789663 C19.3757148,13.7041376 16.6984434,12.7436057 13.6520967,11.5324737 C11.621199,10.7250524 9.97648083,9.72718297 8.71794231,8.53886538 L7.04717308,9.62521154 C9.06194661,11.3700006 10.8411363,12.5664934 12.3847422,13.2146899 C14.4228927,14.0705575 18.0163376,15.1301608 23.1650769,16.3935 Z" id="Fill-17"></path>
|
||||
<path d="M4.57875,11.2299231 L2.92990385,12.3018462 C2.98759615,12.3612692 3.04009615,12.423 3.09951923,12.4818462 C7.31625,16.6985769 12.5743269,17.9949231 17.6599038,19.2485769 C22.0641346,20.3337692 26.2543269,21.3687692 29.7989423,24.1581923 L31.4893269,23.0591538 C27.4958654,19.6968462 22.7385577,18.5158846 18.1214423,17.3781923 C13.1206731,16.1453077 8.39567308,14.9758846 4.57875,11.2299231" id="Fill-19"></path>
|
||||
<path d="M1.07555769,14.5060962 C0.883442308,14.3139808 0.702865385,14.1184038 0.524019231,13.9216731 C-0.227711538,14.6745577 -0.139442308,15.9726346 0.80325,16.5853269 L6.50959615,20.2955192 C9.03536538,21.3409038 11.6765192,21.9945577 14.2738269,22.6349423 C18.3284423,23.6341731 22.2019038,24.5924423 25.5578654,26.9157115 L27.2834423,25.7930192 C23.4676731,22.9245577 19.0403654,21.8255192 14.7347885,20.7639808 C9.68382692,19.5189808 4.91267308,18.3432115 1.07555769,14.5060962" id="Fill-21"></path>
|
||||
<path d="M19.6441154,28.8342692 C20.0243077,29.0188846 20.3998846,29.2133077 20.7691154,29.4221538 C21.2093077,29.5150385 21.6771923,29.4383077 22.0683462,29.1838846 L23.0260385,28.5613846 C19.9493077,26.5035 16.5287308,25.461 13.1196923,24.5927308 L19.6441154,28.8342692 Z" id="Fill-23"></path>
|
||||
</g>
|
||||
</g>
|
||||
</svg>
|
||||
|
After Width: | Height: | Size: 8.5 KiB |
BIN
docs/logo/flagger-icon-white@2x.png
Normal file
|
After Width: | Height: | Size: 4.6 KiB |
|
Before Width: | Height: | Size: 30 KiB |