mirror of
https://github.com/fluxcd/flagger.git
synced 2026-02-28 00:33:57 +00:00
433 lines
15 KiB
Markdown
433 lines
15 KiB
Markdown
# flagger
|
|
|
|
[](https://travis-ci.org/stefanprodan/flagger)
|
|
[](https://goreportcard.com/report/github.com/stefanprodan/flagger)
|
|
[](https://codecov.io/gh/stefanprodan/flagger)
|
|
[](https://github.com/stefanprodan/flagger/blob/master/LICENSE)
|
|
[](https://github.com/stefanprodan/flagger/releases)
|
|
|
|
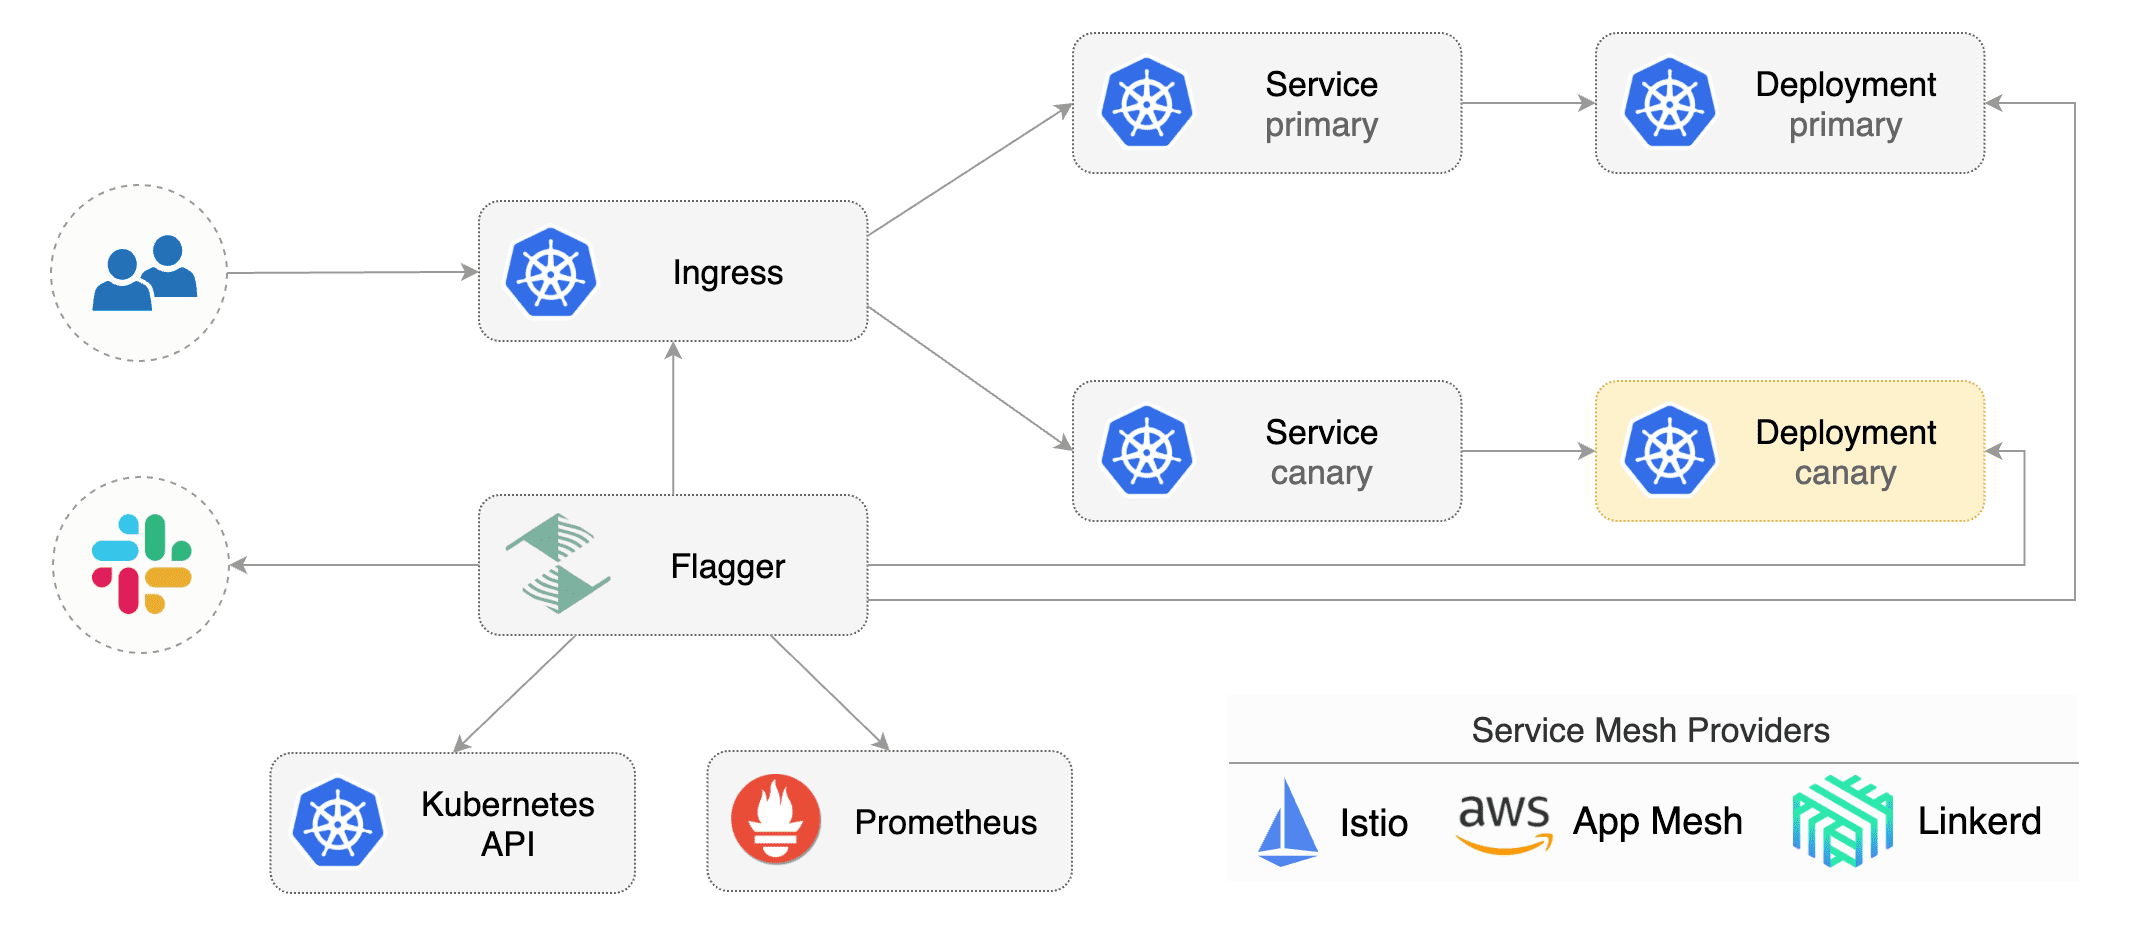
Flagger is a Kubernetes operator that automates the promotion of canary deployments
|
|
using Istio routing for traffic shifting and Prometheus metrics for canary analysis.
|
|
The canary analysis can be extended with webhooks for running integration tests, load tests or any other custom
|
|
validation.
|
|
|
|
### Install
|
|
|
|
Before installing Flagger make sure you have Istio setup up with Prometheus enabled.
|
|
If you are new to Istio you can follow my [Istio service mesh walk-through](https://github.com/stefanprodan/istio-gke).
|
|
|
|
Deploy Flagger in the `istio-system` namespace using Helm:
|
|
|
|
```bash
|
|
# add the Helm repository
|
|
helm repo add flagger https://flagger.app
|
|
|
|
# install or upgrade
|
|
helm upgrade -i flagger flagger/flagger \
|
|
--namespace=istio-system \
|
|
--set metricsServer=http://prometheus.istio-system:9090 \
|
|
--set controlLoopInterval=1m
|
|
```
|
|
|
|
Flagger is compatible with Kubernetes >1.10.0 and Istio >1.0.0.
|
|
|
|
### Usage
|
|
|
|
Flagger takes a Kubernetes deployment and creates a series of objects
|
|
(Kubernetes [deployments](https://kubernetes.io/docs/concepts/workloads/controllers/deployment/),
|
|
ClusterIP [services](https://kubernetes.io/docs/concepts/services-networking/service/) and
|
|
Istio [virtual services](https://istio.io/docs/reference/config/istio.networking.v1alpha3/#VirtualService))
|
|
to drive the canary analysis and promotion.
|
|
|
|
|
|
|
|
Gated canary promotion stages:
|
|
|
|
* scan for canary deployments
|
|
* check Istio virtual service routes are mapped to primary and canary ClusterIP services
|
|
* check primary and canary deployments status
|
|
* halt advancement if a rolling update is underway
|
|
* halt advancement if pods are unhealthy
|
|
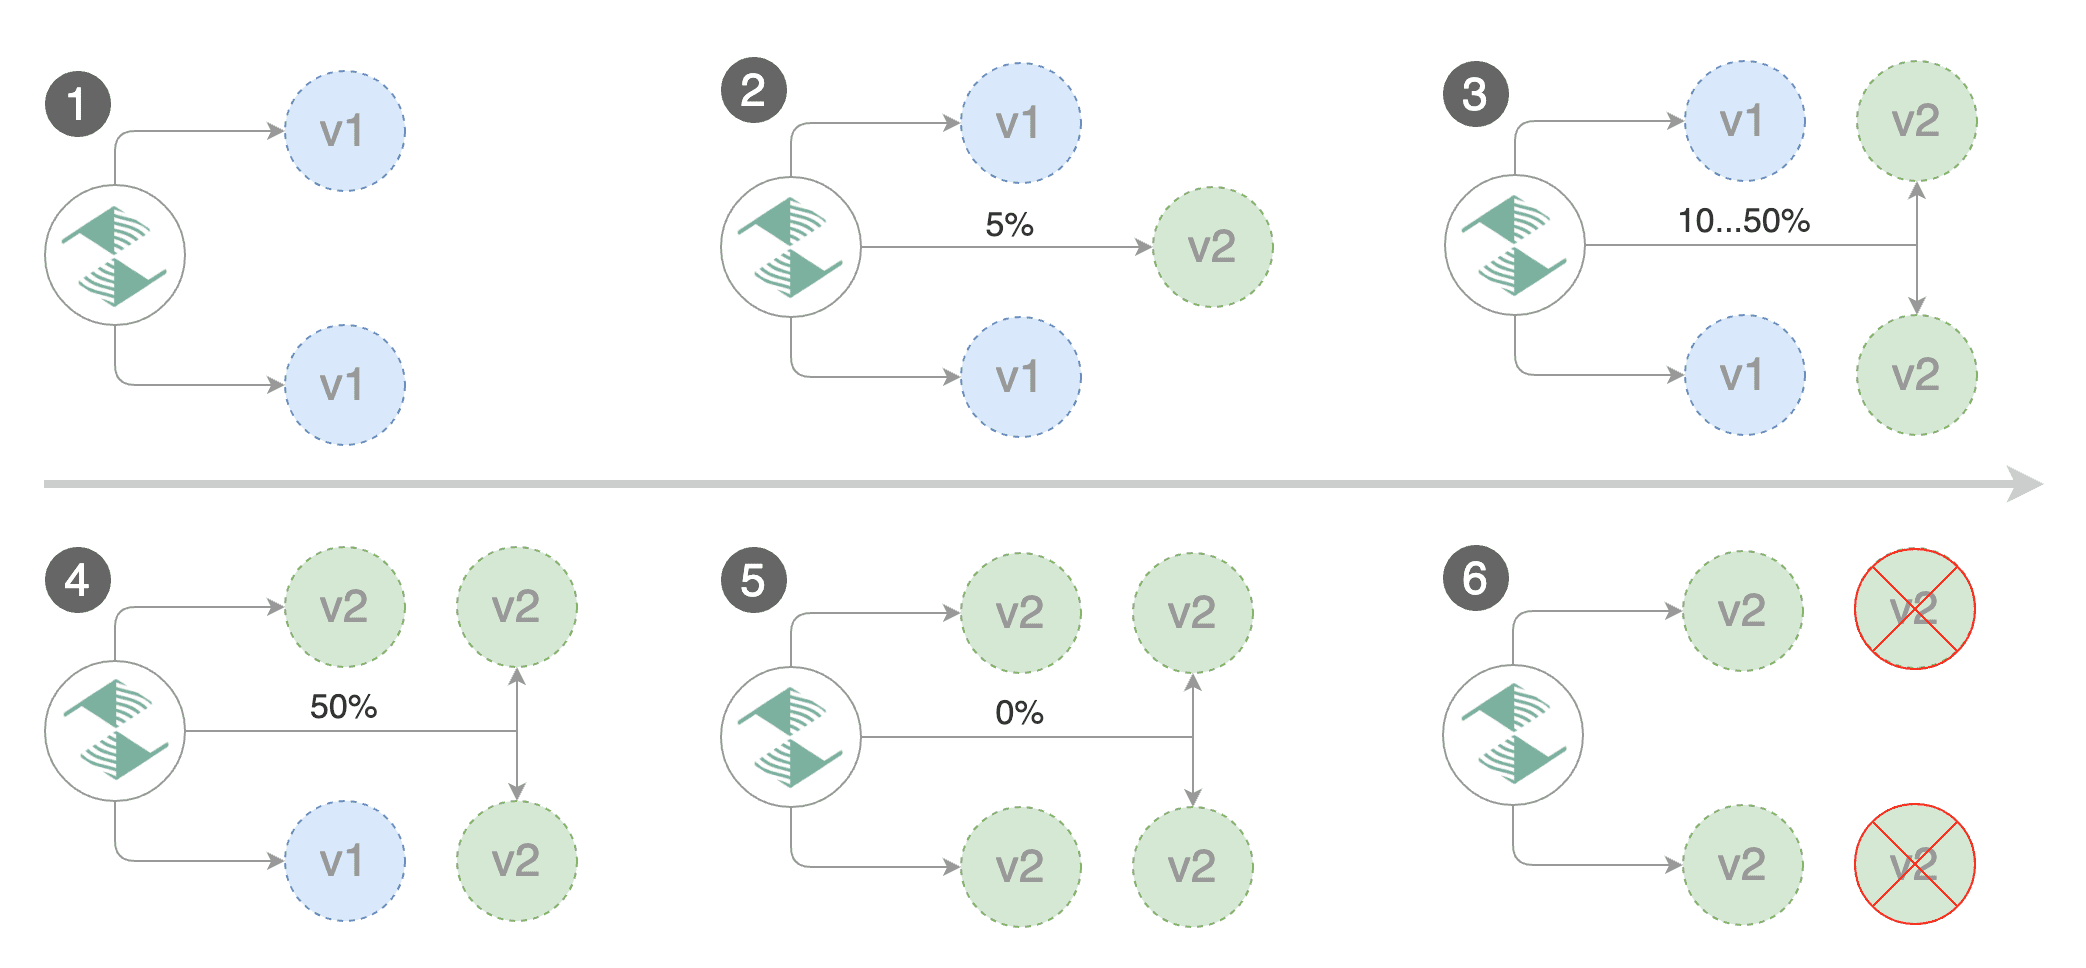
* increase canary traffic weight percentage from 0% to 5% (step weight)
|
|
* check canary HTTP request success rate and latency
|
|
* halt advancement if any metric is under the specified threshold
|
|
* increment the failed checks counter
|
|
* check if the number of failed checks reached the threshold
|
|
* route all traffic to primary
|
|
* scale to zero the canary deployment and mark it as failed
|
|
* wait for the canary deployment to be updated (revision bump) and start over
|
|
* increase canary traffic weight by 5% (step weight) till it reaches 50% (max weight)
|
|
* halt advancement while canary request success rate is under the threshold
|
|
* halt advancement while canary request duration P99 is over the threshold
|
|
* halt advancement if the primary or canary deployment becomes unhealthy
|
|
* halt advancement while canary deployment is being scaled up/down by HPA
|
|
* promote canary to primary
|
|
* copy canary deployment spec template over primary
|
|
* wait for primary rolling update to finish
|
|
* halt advancement if pods are unhealthy
|
|
* route all traffic to primary
|
|
* scale to zero the canary deployment
|
|
* mark rollout as finished
|
|
* wait for the canary deployment to be updated (revision bump) and start over
|
|
|
|
You can change the canary analysis _max weight_ and the _step weight_ percentage in the Flagger's custom resource.
|
|
|
|
For a deployment named _podinfo_, a canary promotion can be defined using Flagger's custom resource:
|
|
|
|
```yaml
|
|
apiVersion: flagger.app/v1alpha2
|
|
kind: Canary
|
|
metadata:
|
|
name: podinfo
|
|
namespace: test
|
|
spec:
|
|
# deployment reference
|
|
targetRef:
|
|
apiVersion: apps/v1
|
|
kind: Deployment
|
|
name: podinfo
|
|
# the maximum time in seconds for the canary deployment
|
|
# to make progress before it is rollback (default 600s)
|
|
progressDeadlineSeconds: 60
|
|
# HPA reference (optional)
|
|
autoscalerRef:
|
|
apiVersion: autoscaling/v2beta1
|
|
kind: HorizontalPodAutoscaler
|
|
name: podinfo
|
|
service:
|
|
# container port
|
|
port: 9898
|
|
# Istio gateways (optional)
|
|
gateways:
|
|
- public-gateway.istio-system.svc.cluster.local
|
|
# Istio virtual service host names (optional)
|
|
hosts:
|
|
- app.iowa.weavedx.com
|
|
canaryAnalysis:
|
|
# max number of failed metric checks before rollback
|
|
threshold: 10
|
|
# max traffic percentage routed to canary
|
|
# percentage (0-100)
|
|
maxWeight: 50
|
|
# canary increment step
|
|
# percentage (0-100)
|
|
stepWeight: 5
|
|
# Istio Prometheus checks
|
|
metrics:
|
|
- name: istio_requests_total
|
|
# minimum req success rate (non 5xx responses)
|
|
# percentage (0-100)
|
|
threshold: 99
|
|
interval: 1m
|
|
- name: istio_request_duration_seconds_bucket
|
|
# maximum req duration P99
|
|
# milliseconds
|
|
threshold: 500
|
|
interval: 30s
|
|
# external checks (optional)
|
|
webhooks:
|
|
- name: integration-tests
|
|
url: http://podinfo.test:9898/echo
|
|
timeout: 1m
|
|
metadata:
|
|
test: "all"
|
|
token: "16688eb5e9f289f1991c"
|
|
```
|
|
|
|
The canary analysis is using the following promql queries:
|
|
|
|
_HTTP requests success rate percentage_
|
|
|
|
```sql
|
|
sum(
|
|
rate(
|
|
istio_requests_total{
|
|
reporter="destination",
|
|
destination_workload_namespace=~"$namespace",
|
|
destination_workload=~"$workload",
|
|
response_code!~"5.*"
|
|
}[$interval]
|
|
)
|
|
)
|
|
/
|
|
sum(
|
|
rate(
|
|
istio_requests_total{
|
|
reporter="destination",
|
|
destination_workload_namespace=~"$namespace",
|
|
destination_workload=~"$workload"
|
|
}[$interval]
|
|
)
|
|
)
|
|
```
|
|
|
|
_HTTP requests milliseconds duration P99_
|
|
|
|
```sql
|
|
histogram_quantile(0.99,
|
|
sum(
|
|
irate(
|
|
istio_request_duration_seconds_bucket{
|
|
reporter="destination",
|
|
destination_workload=~"$workload",
|
|
destination_workload_namespace=~"$namespace"
|
|
}[$interval]
|
|
)
|
|
) by (le)
|
|
)
|
|
```
|
|
|
|
The canary analysis can be extended with webhooks.
|
|
Flagger will call the webhooks (HTTP POST) and determine from the response status code (HTTP 2xx) if the canary is failing or not.
|
|
|
|
Webhook payload:
|
|
|
|
```json
|
|
{
|
|
"name": "podinfo",
|
|
"namespace": "test",
|
|
"metadata": {
|
|
"test": "all",
|
|
"token": "16688eb5e9f289f1991c"
|
|
}
|
|
}
|
|
```
|
|
|
|
### Automated canary analysis, promotions and rollbacks
|
|
|
|
Create a test namespace with Istio sidecar injection enabled:
|
|
|
|
```bash
|
|
export REPO=https://raw.githubusercontent.com/stefanprodan/flagger/master
|
|
|
|
kubectl apply -f ${REPO}/artifacts/namespaces/test.yaml
|
|
```
|
|
|
|
Create a deployment and a horizontal pod autoscaler:
|
|
|
|
```bash
|
|
kubectl apply -f ${REPO}/artifacts/canaries/deployment.yaml
|
|
kubectl apply -f ${REPO}/artifacts/canaries/hpa.yaml
|
|
```
|
|
|
|
Create a canary promotion custom resource (replace the Istio gateway and the internet domain with your own):
|
|
|
|
```bash
|
|
kubectl apply -f ${REPO}/artifacts/canaries/canary.yaml
|
|
```
|
|
|
|
After a couple of seconds Flagger will create the canary objects:
|
|
|
|
```bash
|
|
# applied
|
|
deployment.apps/podinfo
|
|
horizontalpodautoscaler.autoscaling/podinfo
|
|
canary.flagger.app/podinfo
|
|
# generated
|
|
deployment.apps/podinfo-primary
|
|
horizontalpodautoscaler.autoscaling/podinfo-primary
|
|
service/podinfo
|
|
service/podinfo-canary
|
|
service/podinfo-primary
|
|
virtualservice.networking.istio.io/podinfo
|
|
```
|
|
|
|
|
|
|
|
Trigger a canary deployment by updating the container image:
|
|
|
|
```bash
|
|
kubectl -n test set image deployment/podinfo \
|
|
podinfod=quay.io/stefanprodan/podinfo:1.2.1
|
|
```
|
|
|
|
Flagger detects that the deployment revision changed and starts a new rollout:
|
|
|
|
```
|
|
kubectl -n test describe canary/podinfo
|
|
|
|
Status:
|
|
Canary Revision: 19871136
|
|
Failed Checks: 0
|
|
State: finished
|
|
Events:
|
|
Type Reason Age From Message
|
|
---- ------ ---- ---- -------
|
|
Normal Synced 3m flagger New revision detected podinfo.test
|
|
Normal Synced 3m flagger Scaling up podinfo.test
|
|
Warning Synced 3m flagger Waiting for podinfo.test rollout to finish: 0 of 1 updated replicas are available
|
|
Normal Synced 3m flagger Advance podinfo.test canary weight 5
|
|
Normal Synced 3m flagger Advance podinfo.test canary weight 10
|
|
Normal Synced 3m flagger Advance podinfo.test canary weight 15
|
|
Normal Synced 2m flagger Advance podinfo.test canary weight 20
|
|
Normal Synced 2m flagger Advance podinfo.test canary weight 25
|
|
Normal Synced 1m flagger Advance podinfo.test canary weight 30
|
|
Normal Synced 1m flagger Advance podinfo.test canary weight 35
|
|
Normal Synced 55s flagger Advance podinfo.test canary weight 40
|
|
Normal Synced 45s flagger Advance podinfo.test canary weight 45
|
|
Normal Synced 35s flagger Advance podinfo.test canary weight 50
|
|
Normal Synced 25s flagger Copying podinfo.test template spec to podinfo-primary.test
|
|
Warning Synced 15s flagger Waiting for podinfo-primary.test rollout to finish: 1 of 2 updated replicas are available
|
|
Normal Synced 5s flagger Promotion completed! Scaling down podinfo.test
|
|
```
|
|
|
|
During the canary analysis you can generate HTTP 500 errors and high latency to test if Flagger pauses the rollout.
|
|
|
|
Create a tester pod and exec into it:
|
|
|
|
```bash
|
|
kubectl -n test run tester --image=quay.io/stefanprodan/podinfo:1.2.1 -- ./podinfo --port=9898
|
|
kubectl -n test exec -it tester-xx-xx sh
|
|
```
|
|
|
|
Generate HTTP 500 errors:
|
|
|
|
```bash
|
|
watch curl http://podinfo-canary:9898/status/500
|
|
```
|
|
|
|
Generate latency:
|
|
|
|
```bash
|
|
watch curl http://podinfo-canary:9898/delay/1
|
|
```
|
|
|
|
When the number of failed checks reaches the canary analysis threshold, the traffic is routed back to the primary,
|
|
the canary is scaled to zero and the rollout is marked as failed.
|
|
|
|
```
|
|
kubectl -n test describe canary/podinfo
|
|
|
|
Status:
|
|
Canary Revision: 16695041
|
|
Failed Checks: 10
|
|
State: failed
|
|
Events:
|
|
Type Reason Age From Message
|
|
---- ------ ---- ---- -------
|
|
Normal Synced 3m flagger Starting canary deployment for podinfo.test
|
|
Normal Synced 3m flagger Advance podinfo.test canary weight 5
|
|
Normal Synced 3m flagger Advance podinfo.test canary weight 10
|
|
Normal Synced 3m flagger Advance podinfo.test canary weight 15
|
|
Normal Synced 3m flagger Halt podinfo.test advancement success rate 69.17% < 99%
|
|
Normal Synced 2m flagger Halt podinfo.test advancement success rate 61.39% < 99%
|
|
Normal Synced 2m flagger Halt podinfo.test advancement success rate 55.06% < 99%
|
|
Normal Synced 2m flagger Halt podinfo.test advancement success rate 47.00% < 99%
|
|
Normal Synced 2m flagger (combined from similar events): Halt podinfo.test advancement success rate 38.08% < 99%
|
|
Warning Synced 1m flagger Rolling back podinfo.test failed checks threshold reached 10
|
|
Warning Synced 1m flagger Canary failed! Scaling down podinfo.test
|
|
```
|
|
|
|
### Monitoring
|
|
|
|
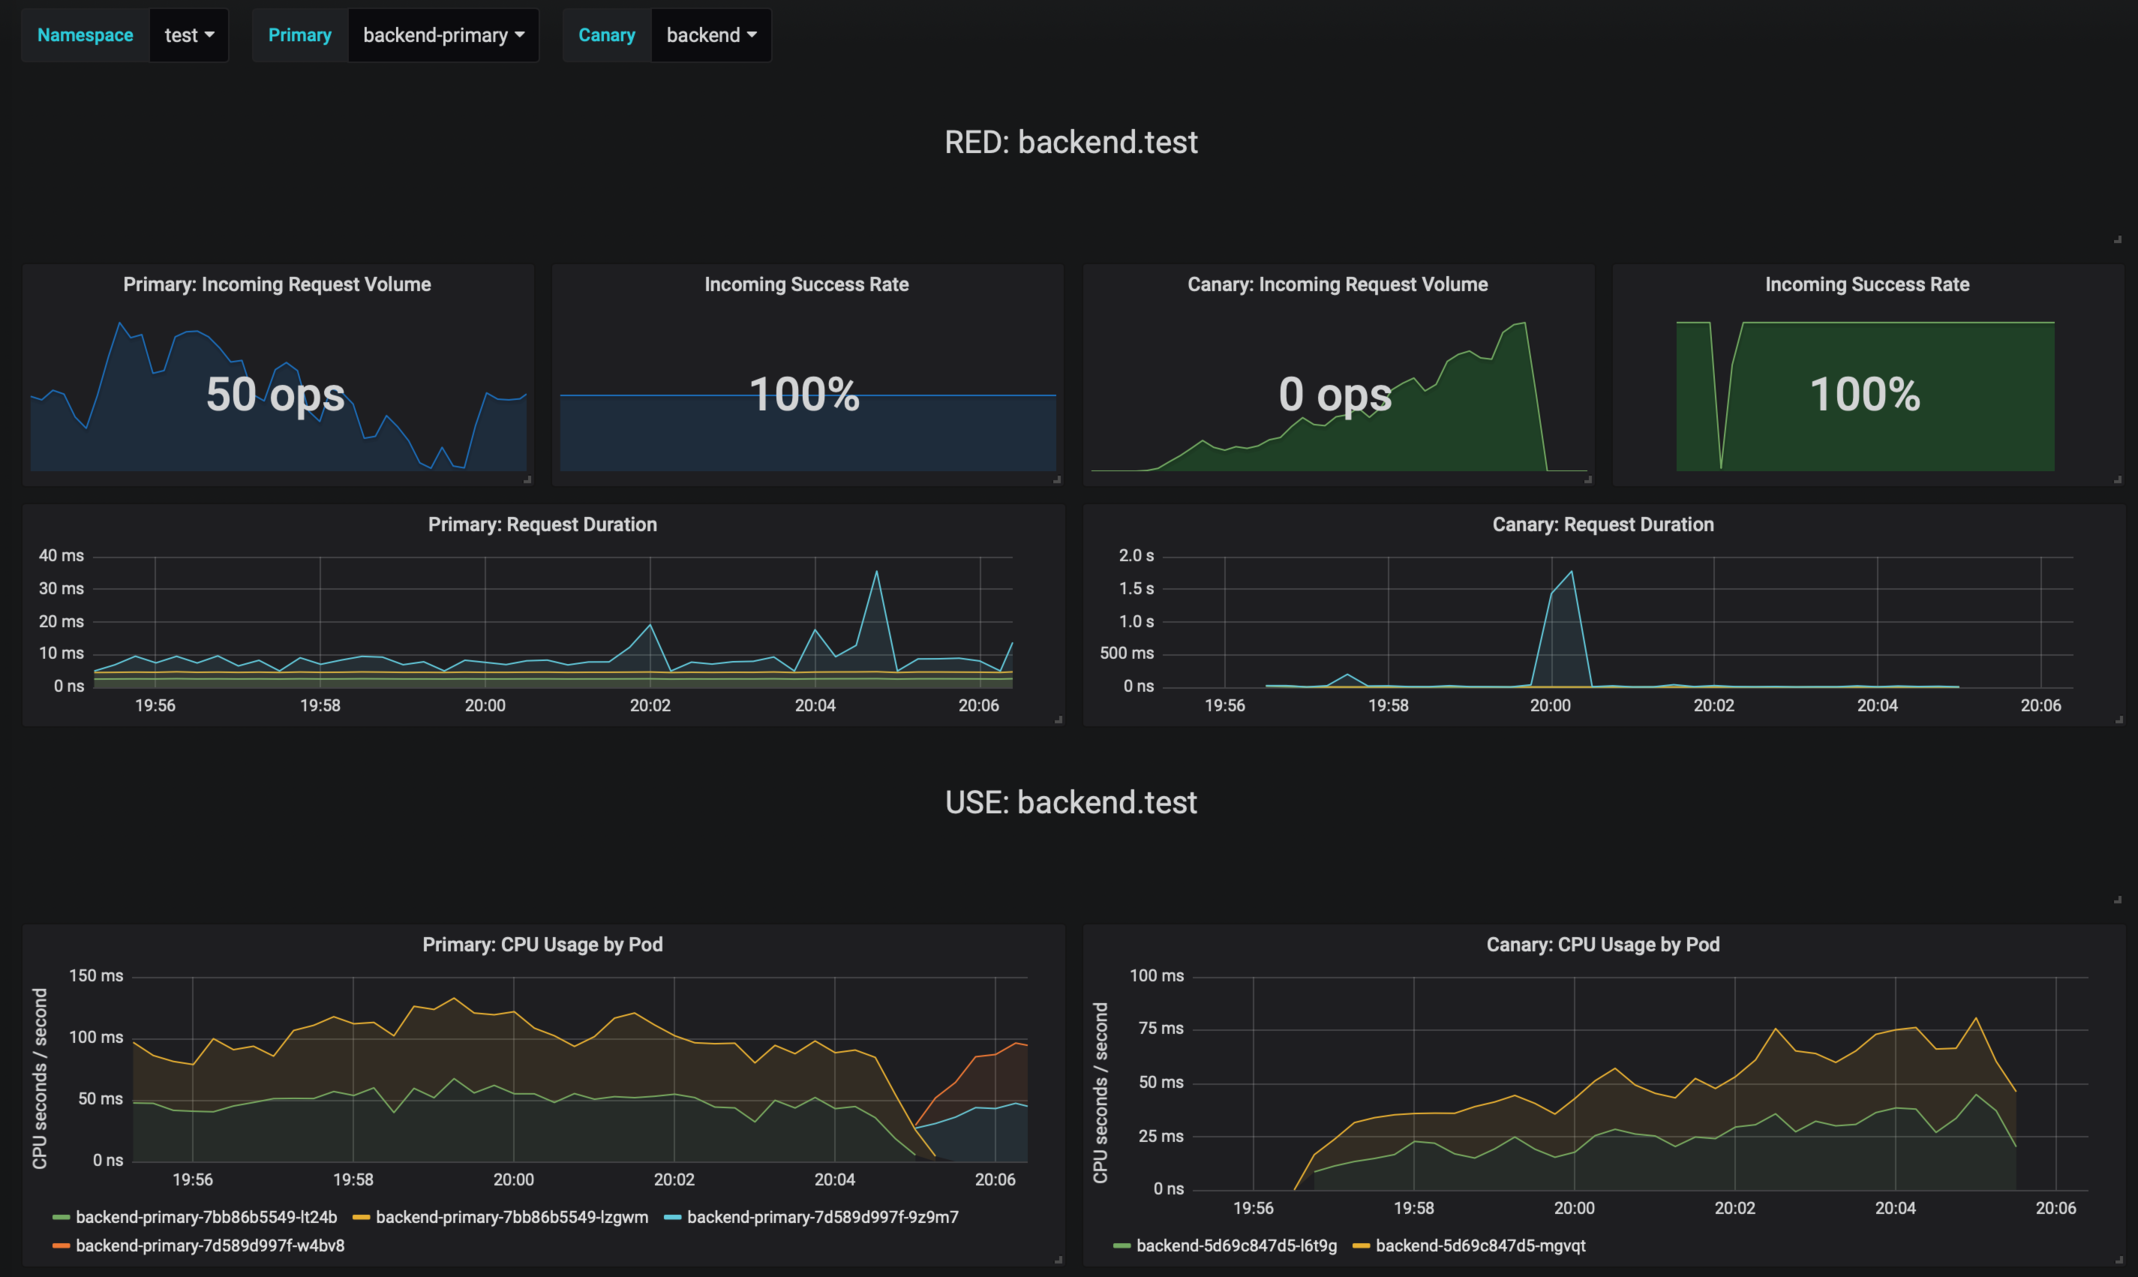
Flagger comes with a Grafana dashboard made for canary analysis.
|
|
|
|
Install Grafana with Helm:
|
|
|
|
```bash
|
|
helm upgrade -i flagger-grafana flagger/grafana \
|
|
--namespace=istio-system \
|
|
--set url=http://prometheus.istio-system:9090
|
|
```
|
|
|
|
The dashboard shows the RED and USE metrics for the primary and canary workloads:
|
|
|
|
|
|
|
|
The canary errors and latency spikes have been recorded as Kubernetes events and logged by Flagger in json format:
|
|
|
|
```
|
|
kubectl -n istio-system logs deployment/flagger --tail=100 | jq .msg
|
|
|
|
Starting canary deployment for podinfo.test
|
|
Advance podinfo.test canary weight 5
|
|
Advance podinfo.test canary weight 10
|
|
Advance podinfo.test canary weight 15
|
|
Advance podinfo.test canary weight 20
|
|
Advance podinfo.test canary weight 25
|
|
Advance podinfo.test canary weight 30
|
|
Advance podinfo.test canary weight 35
|
|
Halt podinfo.test advancement success rate 98.69% < 99%
|
|
Advance podinfo.test canary weight 40
|
|
Halt podinfo.test advancement request duration 1.515s > 500ms
|
|
Advance podinfo.test canary weight 45
|
|
Advance podinfo.test canary weight 50
|
|
Copying podinfo.test template spec to podinfo-primary.test
|
|
Halt podinfo-primary.test advancement waiting for rollout to finish: 1 old replicas are pending termination
|
|
Scaling down podinfo.test
|
|
Promotion completed! podinfo.test
|
|
```
|
|
|
|
Flagger exposes Prometheus metrics that can be used to determine the canary analysis status and the destination weight values:
|
|
|
|
```bash
|
|
# Canaries total gauge
|
|
flagger_canary_total{namespace="test"} 1
|
|
|
|
# Canary promotion last known status gauge
|
|
# 0 - running, 1 - successful, 2 - failed
|
|
flagger_canary_status{name="podinfo" namespace="test"} 1
|
|
|
|
# Canary traffic weight gauge
|
|
flagger_canary_weight{workload="podinfo-primary" namespace="test"} 95
|
|
flagger_canary_weight{workload="podinfo" namespace="test"} 5
|
|
|
|
# Seconds spent performing canary analysis histogram
|
|
flagger_canary_duration_seconds_bucket{name="podinfo",namespace="test",le="10"} 6
|
|
flagger_canary_duration_seconds_bucket{name="podinfo",namespace="test",le="+Inf"} 6
|
|
flagger_canary_duration_seconds_sum{name="podinfo",namespace="test"} 17.3561329
|
|
flagger_canary_duration_seconds_count{name="podinfo",namespace="test"} 6
|
|
```
|
|
|
|
### Alerting
|
|
|
|
Flagger can be configured to send Slack notifications:
|
|
|
|
```bash
|
|
helm upgrade -i flagger flagger/flagger \
|
|
--namespace=istio-system \
|
|
--set slack.url=https://hooks.slack.com/services/YOUR/SLACK/WEBHOOK \
|
|
--set slack.channel=general \
|
|
--set slack.user=flagger
|
|
```
|
|
|
|
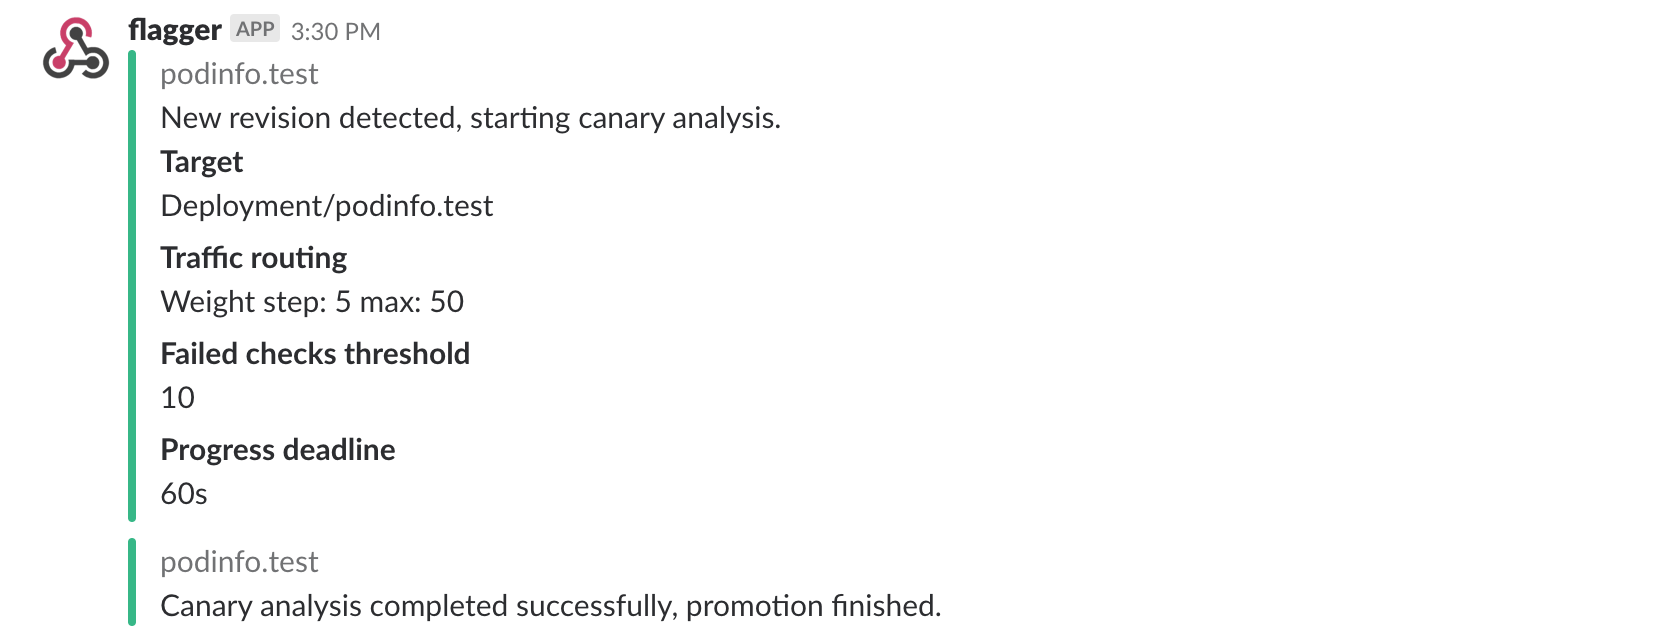
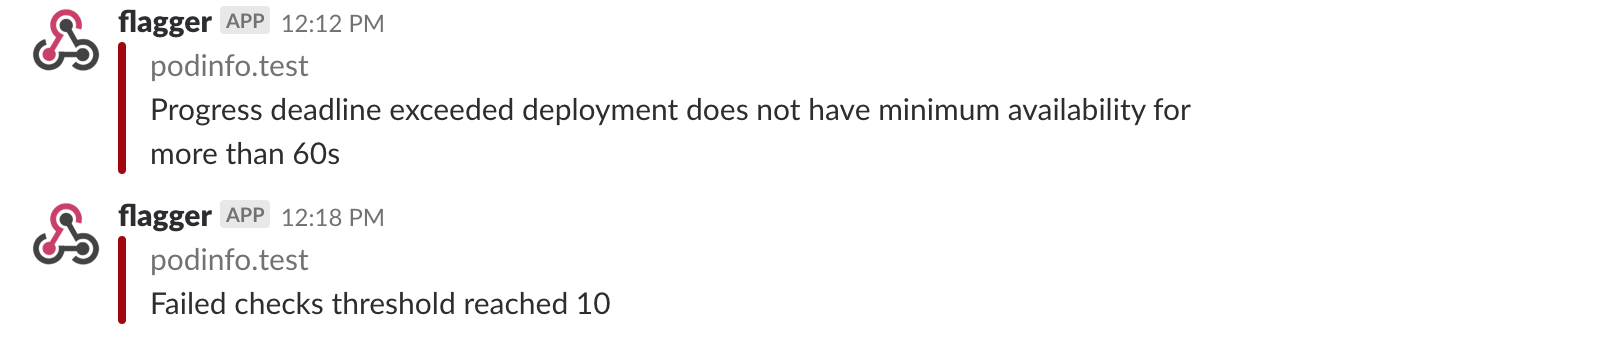
Once configured with a Slack incoming webhook, Flagger will post messages when a canary deployment has been initialized,
|
|
when a new revision has been detected and if the canary analysis failed or succeeded.
|
|
|
|
|
|
|
|
A canary deployment will be rolled back if the progress deadline exceeded or if the analysis
|
|
reached the maximum number of failed checks:
|
|
|
|
|
|
|
|
Besides Slack, you can use Alertmanager to trigger alerts when a canary deployment failed:
|
|
|
|
```yaml
|
|
- alert: canary_rollback
|
|
expr: flagger_canary_status > 1
|
|
for: 1m
|
|
labels:
|
|
severity: warning
|
|
annotations:
|
|
summary: "Canary failed"
|
|
description: "Workload {{ $labels.name }} namespace {{ $labels.namespace }}"
|
|
```
|
|
|
|
### Roadmap
|
|
|
|
* Extend the validation mechanism to support other metrics than HTTP success rate and latency
|
|
* Add support for comparing the canary metrics to the primary ones and do the validation based on the derivation between the two
|
|
* Extend the canary analysis and promotion to other types than Kubernetes deployments such as Flux Helm releases or OpenFaaS functions
|
|
|
|
### Contributing
|
|
|
|
Flagger is Apache 2.0 licensed and accepts contributions via GitHub pull requests.
|
|
|
|
When submitting bug reports please include as much details as possible:
|
|
* which Flagger version
|
|
* which Flagger CRD version
|
|
* which Kubernetes/Istio version
|
|
* what configuration (canary, virtual service and workloads definitions)
|
|
* what happened (Flagger, Istio Pilot and Proxy logs)
|