mirror of
https://github.com/fluxcd/flagger.git
synced 2026-04-15 06:57:34 +00:00
744 lines
21 KiB
Markdown
744 lines
21 KiB
Markdown
# How it works
|
|
|
|
[Flagger](https://github.com/weaveworks/flagger) takes a Kubernetes deployment and optionally
|
|
a horizontal pod autoscaler \(HPA\) and creates a series of objects
|
|
\(Kubernetes deployments, ClusterIP services and Istio or App Mesh virtual services\) to drive the canary analysis and promotion.
|
|
|
|

|
|
|
|
### Canary Custom Resource
|
|
|
|
For a deployment named _podinfo_, a canary promotion can be defined using Flagger's custom resource:
|
|
|
|
```yaml
|
|
apiVersion: flagger.app/v1alpha3
|
|
kind: Canary
|
|
metadata:
|
|
name: podinfo
|
|
namespace: test
|
|
spec:
|
|
# deployment reference
|
|
targetRef:
|
|
apiVersion: apps/v1
|
|
kind: Deployment
|
|
name: podinfo
|
|
# the maximum time in seconds for the canary deployment
|
|
# to make progress before it is rollback (default 600s)
|
|
progressDeadlineSeconds: 60
|
|
# HPA reference (optional)
|
|
autoscalerRef:
|
|
apiVersion: autoscaling/v2beta1
|
|
kind: HorizontalPodAutoscaler
|
|
name: podinfo
|
|
service:
|
|
# container port
|
|
port: 9898
|
|
# service port name (optional, will default to "http")
|
|
portName: http-podinfo
|
|
# Istio gateways (optional)
|
|
gateways:
|
|
- public-gateway.istio-system.svc.cluster.local
|
|
# Istio virtual service host names (optional)
|
|
hosts:
|
|
- podinfo.example.com
|
|
# promote the canary without analysing it (default false)
|
|
skipAnalysis: false
|
|
# define the canary analysis timing and KPIs
|
|
canaryAnalysis:
|
|
# schedule interval (default 60s)
|
|
interval: 1m
|
|
# max number of failed metric checks before rollback
|
|
threshold: 10
|
|
# max traffic percentage routed to canary
|
|
# percentage (0-100)
|
|
maxWeight: 50
|
|
# canary increment step
|
|
# percentage (0-100)
|
|
stepWeight: 5
|
|
# Prometheus checks
|
|
metrics:
|
|
- name: request-success-rate
|
|
# minimum req success rate (non 5xx responses)
|
|
# percentage (0-100)
|
|
threshold: 99
|
|
interval: 1m
|
|
- name: request-duration
|
|
# maximum req duration P99
|
|
# milliseconds
|
|
threshold: 500
|
|
interval: 30s
|
|
# external checks (optional)
|
|
webhooks:
|
|
- name: integration-tests
|
|
url: http://podinfo.test:9898/echo
|
|
timeout: 1m
|
|
# key-value pairs (optional)
|
|
metadata:
|
|
test: "all"
|
|
token: "16688eb5e9f289f1991c"
|
|
```
|
|
|
|
**Note** that the target deployment must have a single label selector in the format `app: <DEPLOYMENT-NAME>`:
|
|
|
|
```yaml
|
|
apiVersion: apps/v1
|
|
kind: Deployment
|
|
metadata:
|
|
name: podinfo
|
|
spec:
|
|
selector:
|
|
matchLabels:
|
|
app: podinfo
|
|
template:
|
|
metadata:
|
|
labels:
|
|
app: podinfo
|
|
```
|
|
|
|
Besides `app` Flagger supports `name` and `app.kubernetes.io/name` selectors. If you use a different
|
|
convention you can specify your label with the `-selector-labels` flag.
|
|
|
|
The target deployment should expose a TCP port that will be used by Flagger to create the ClusterIP Service and
|
|
the Istio Virtual Service. The container port from the target deployment should match the `service.port` value.
|
|
|
|
### Istio routing
|
|
|
|
Flagger creates an Istio Virtual Service based on the Canary service spec. The service configuration lets you expose
|
|
an app inside or outside the mesh.
|
|
You can also define HTTP match conditions, URI rewrite rules, CORS policies, timeout and retries.
|
|
|
|
The following spec exposes the `frontend` workload inside the mesh on `frontend.test.svc.cluster.local:9898`
|
|
and outside the mesh on `frontend.example.com`. You'll have to specify an Istio ingress gateway for external hosts.
|
|
|
|
```yaml
|
|
apiVersion: flagger.app/v1alpha3
|
|
kind: Canary
|
|
metadata:
|
|
name: frontend
|
|
namespace: test
|
|
spec:
|
|
service:
|
|
# container port
|
|
port: 9898
|
|
# service port name (optional, will default to "http")
|
|
portName: http-frontend
|
|
# Istio gateways (optional)
|
|
gateways:
|
|
- public-gateway.istio-system.svc.cluster.local
|
|
- mesh
|
|
# Istio virtual service host names (optional)
|
|
hosts:
|
|
- frontend.example.com
|
|
# HTTP match conditions (optional)
|
|
match:
|
|
- uri:
|
|
prefix: /
|
|
# HTTP rewrite (optional)
|
|
rewrite:
|
|
uri: /
|
|
# Envoy timeout and retry policy (optional)
|
|
headers:
|
|
request:
|
|
add:
|
|
x-envoy-upstream-rq-timeout-ms: "15000"
|
|
x-envoy-max-retries: "10"
|
|
x-envoy-retry-on: "gateway-error,connect-failure,refused-stream"
|
|
# cross-origin resource sharing policy (optional)
|
|
corsPolicy:
|
|
allowOrigin:
|
|
- example.com
|
|
allowMethods:
|
|
- GET
|
|
allowCredentials: false
|
|
allowHeaders:
|
|
- x-some-header
|
|
maxAge: 24h
|
|
```
|
|
|
|
For the above spec Flagger will generate the following virtual service:
|
|
|
|
```yaml
|
|
apiVersion: networking.istio.io/v1alpha3
|
|
kind: VirtualService
|
|
metadata:
|
|
name: frontend
|
|
namespace: test
|
|
ownerReferences:
|
|
- apiVersion: flagger.app/v1alpha3
|
|
blockOwnerDeletion: true
|
|
controller: true
|
|
kind: Canary
|
|
name: podinfo
|
|
uid: 3a4a40dd-3875-11e9-8e1d-42010a9c0fd1
|
|
spec:
|
|
gateways:
|
|
- public-gateway.istio-system.svc.cluster.local
|
|
- mesh
|
|
hosts:
|
|
- frontend.example.com
|
|
- frontend
|
|
http:
|
|
- appendHeaders:
|
|
x-envoy-max-retries: "10"
|
|
x-envoy-retry-on: gateway-error,connect-failure,refused-stream
|
|
x-envoy-upstream-rq-timeout-ms: "15000"
|
|
corsPolicy:
|
|
allowHeaders:
|
|
- x-some-header
|
|
allowMethods:
|
|
- GET
|
|
allowOrigin:
|
|
- example.com
|
|
maxAge: 24h
|
|
match:
|
|
- uri:
|
|
prefix: /
|
|
rewrite:
|
|
uri: /
|
|
route:
|
|
- destination:
|
|
host: podinfo-primary
|
|
port:
|
|
number: 9898
|
|
weight: 100
|
|
- destination:
|
|
host: podinfo-canary
|
|
port:
|
|
number: 9898
|
|
weight: 0
|
|
```
|
|
|
|
Flagger keeps in sync the virtual service with the canary service spec. Any direct modification to the virtual
|
|
service spec will be overwritten.
|
|
|
|
To expose a workload inside the mesh on `http://backend.test.svc.cluster.local:9898`,
|
|
the service spec can contain only the container port:
|
|
|
|
```yaml
|
|
apiVersion: flagger.app/v1alpha3
|
|
kind: Canary
|
|
metadata:
|
|
name: backend
|
|
namespace: test
|
|
spec:
|
|
service:
|
|
port: 9898
|
|
```
|
|
|
|
Based on the above spec, Flagger will create several ClusterIP services like:
|
|
|
|
```yaml
|
|
apiVersion: v1
|
|
kind: Service
|
|
metadata:
|
|
name: backend-primary
|
|
ownerReferences:
|
|
- apiVersion: flagger.app/v1alpha3
|
|
blockOwnerDeletion: true
|
|
controller: true
|
|
kind: Canary
|
|
name: backend
|
|
uid: 2ca1a9c7-2ef6-11e9-bd01-42010a9c0145
|
|
spec:
|
|
type: ClusterIP
|
|
ports:
|
|
- name: http
|
|
port: 9898
|
|
protocol: TCP
|
|
targetPort: 9898
|
|
selector:
|
|
app: backend-primary
|
|
```
|
|
|
|
Flagger works for user facing apps exposed outside the cluster via an ingress gateway
|
|
and for backend HTTP APIs that are accessible only from inside the mesh.
|
|
|
|
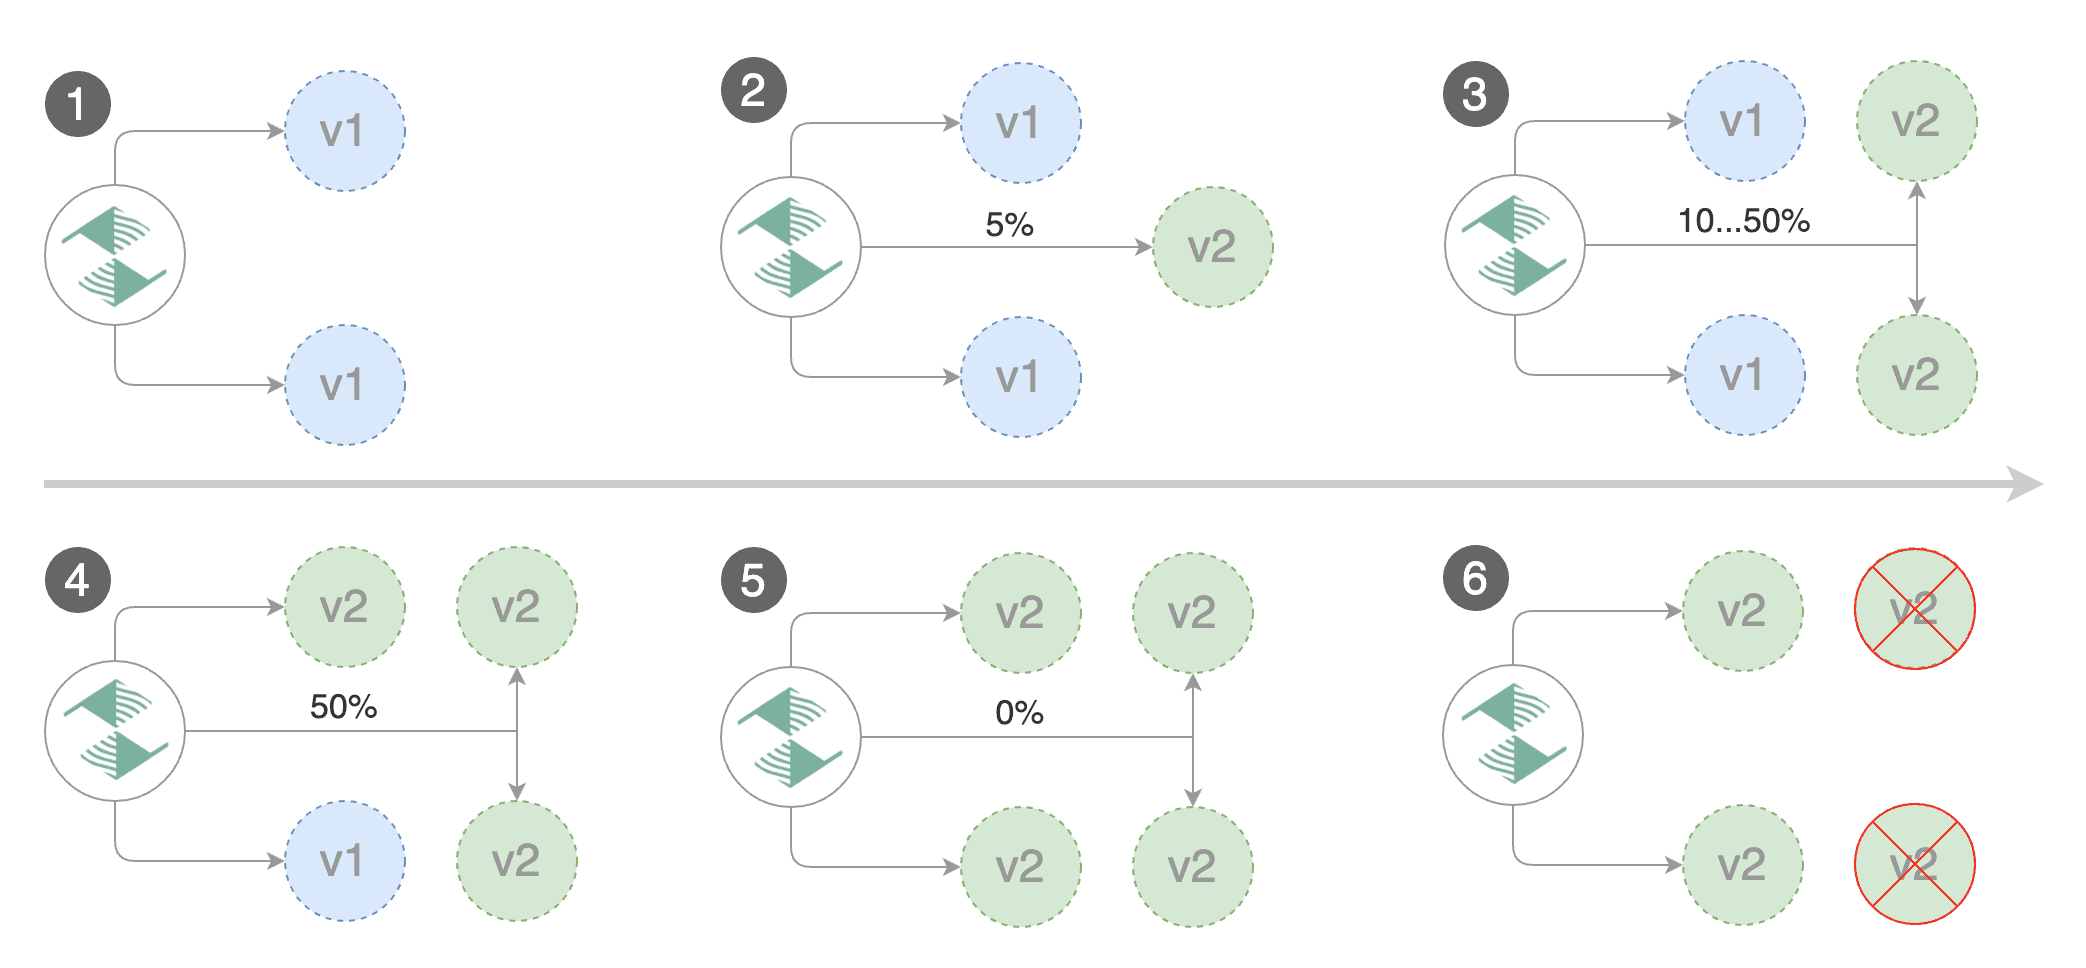
### Canary Stages
|
|
|
|
|
|
|
|
A canary deployment is triggered by changes in any of the following objects:
|
|
|
|
* Deployment PodSpec (container image, command, ports, env, resources, etc)
|
|
* ConfigMaps mounted as volumes or mapped to environment variables
|
|
* Secrets mounted as volumes or mapped to environment variables
|
|
|
|
Gated canary promotion stages:
|
|
|
|
* scan for canary deployments
|
|
* check Istio virtual service routes are mapped to primary and canary ClusterIP services
|
|
* check primary and canary deployments status
|
|
* halt advancement if a rolling update is underway
|
|
* halt advancement if pods are unhealthy
|
|
* call pre-rollout webhooks are check results
|
|
* halt advancement if any hook returned a non HTTP 2xx result
|
|
* increment the failed checks counter
|
|
* increase canary traffic weight percentage from 0% to 5% (step weight)
|
|
* call rollout webhooks and check results
|
|
* check canary HTTP request success rate and latency
|
|
* halt advancement if any metric is under the specified threshold
|
|
* increment the failed checks counter
|
|
* check if the number of failed checks reached the threshold
|
|
* route all traffic to primary
|
|
* scale to zero the canary deployment and mark it as failed
|
|
* call post-rollout webhooks
|
|
* post the analysis result to Slack
|
|
* wait for the canary deployment to be updated and start over
|
|
* increase canary traffic weight by 5% (step weight) till it reaches 50% (max weight)
|
|
* halt advancement if any webhook call fails
|
|
* halt advancement while canary request success rate is under the threshold
|
|
* halt advancement while canary request duration P99 is over the threshold
|
|
* halt advancement if the primary or canary deployment becomes unhealthy
|
|
* halt advancement while canary deployment is being scaled up/down by HPA
|
|
* promote canary to primary
|
|
* copy ConfigMaps and Secrets from canary to primary
|
|
* copy canary deployment spec template over primary
|
|
* wait for primary rolling update to finish
|
|
* halt advancement if pods are unhealthy
|
|
* route all traffic to primary
|
|
* scale to zero the canary deployment
|
|
* mark rollout as finished
|
|
* call post-rollout webhooks
|
|
* post the analysis result to Slack
|
|
* wait for the canary deployment to be updated and start over
|
|
|
|
### Canary Analysis
|
|
|
|
The canary analysis runs periodically until it reaches the maximum traffic weight or the failed checks threshold.
|
|
|
|
Spec:
|
|
|
|
```yaml
|
|
canaryAnalysis:
|
|
# schedule interval (default 60s)
|
|
interval: 1m
|
|
# max number of failed metric checks before rollback
|
|
threshold: 10
|
|
# max traffic percentage routed to canary
|
|
# percentage (0-100)
|
|
maxWeight: 50
|
|
# canary increment step
|
|
# percentage (0-100)
|
|
stepWeight: 2
|
|
# deploy straight to production without
|
|
# the metrics and webhook checks
|
|
skipAnalysis: false
|
|
```
|
|
|
|
The above analysis, if it succeeds, will run for 25 minutes while validating the HTTP metrics and webhooks every minute.
|
|
You can determine the minimum time that it takes to validate and promote a canary deployment using this formula:
|
|
|
|
```
|
|
interval * (maxWeight / stepWeight)
|
|
```
|
|
|
|
And the time it takes for a canary to be rollback when the metrics or webhook checks are failing:
|
|
|
|
```
|
|
interval * threshold
|
|
```
|
|
|
|
In emergency cases, you may want to skip the analysis phase and ship changes directly to production.
|
|
At any time you can set the `spec.skipAnalysis: true`.
|
|
When skip analysis is enabled, Flagger checks if the canary deployment is healthy and
|
|
promotes it without analysing it. If an analysis is underway, Flagger cancels it and runs the promotion.
|
|
|
|
### A/B Testing
|
|
|
|
Besides weighted routing, Flagger can be configured to route traffic to the canary based on HTTP match conditions.
|
|
In an A/B testing scenario, you'll be using HTTP headers or cookies to target a certain segment of your users.
|
|
This is particularly useful for frontend applications that require session affinity.
|
|
|
|
You can enable A/B testing by specifying the HTTP match conditions and the number of iterations:
|
|
|
|
```yaml
|
|
canaryAnalysis:
|
|
# schedule interval (default 60s)
|
|
interval: 1m
|
|
# total number of iterations
|
|
iterations: 10
|
|
# max number of failed iterations before rollback
|
|
threshold: 2
|
|
# canary match condition
|
|
match:
|
|
- headers:
|
|
user-agent:
|
|
regex: "^(?!.*Chrome).*Safari.*"
|
|
- headers:
|
|
cookie:
|
|
regex: "^(.*?;)?(user=test)(;.*)?$"
|
|
```
|
|
|
|
If Flagger finds a HTTP match condition, it will ignore the `maxWeight` and `stepWeight` settings.
|
|
|
|
The above configuration will run an analysis for ten minutes targeting the Safari users and those that have a test cookie.
|
|
You can determine the minimum time that it takes to validate and promote a canary deployment using this formula:
|
|
|
|
```
|
|
interval * iterations
|
|
```
|
|
|
|
And the time it takes for a canary to be rollback when the metrics or webhook checks are failing:
|
|
|
|
```
|
|
interval * threshold
|
|
```
|
|
|
|
Make sure that the analysis threshold is lower than the number of iterations.
|
|
|
|
### HTTP Metrics
|
|
|
|
The canary analysis is using the following Prometheus queries:
|
|
|
|
**HTTP requests success rate percentage**
|
|
|
|
Spec:
|
|
|
|
```yaml
|
|
canaryAnalysis:
|
|
metrics:
|
|
- name: request-success-rate
|
|
# minimum req success rate (non 5xx responses)
|
|
# percentage (0-100)
|
|
threshold: 99
|
|
interval: 1m
|
|
```
|
|
|
|
Istio query:
|
|
|
|
```javascript
|
|
sum(
|
|
rate(
|
|
istio_requests_total{
|
|
reporter="destination",
|
|
destination_workload_namespace=~"$namespace",
|
|
destination_workload=~"$workload",
|
|
response_code!~"5.*"
|
|
}[$interval]
|
|
)
|
|
)
|
|
/
|
|
sum(
|
|
rate(
|
|
istio_requests_total{
|
|
reporter="destination",
|
|
destination_workload_namespace=~"$namespace",
|
|
destination_workload=~"$workload"
|
|
}[$interval]
|
|
)
|
|
)
|
|
```
|
|
|
|
App Mesh query:
|
|
|
|
```javascript
|
|
sum(
|
|
rate(
|
|
envoy_cluster_upstream_rq{
|
|
kubernetes_namespace="$namespace",
|
|
kubernetes_pod_name=~"$workload",
|
|
response_code!~"5.*"
|
|
}[$interval]
|
|
)
|
|
)
|
|
/
|
|
sum(
|
|
rate(
|
|
envoy_cluster_upstream_rq{
|
|
kubernetes_namespace="$namespace",
|
|
kubernetes_pod_name=~"$workload"
|
|
}[$interval]
|
|
)
|
|
)
|
|
```
|
|
|
|
**HTTP requests milliseconds duration P99**
|
|
|
|
Spec:
|
|
|
|
```yaml
|
|
canaryAnalysis:
|
|
metrics:
|
|
- name: request-duration
|
|
# maximum req duration P99
|
|
# milliseconds
|
|
threshold: 500
|
|
interval: 1m
|
|
```
|
|
|
|
Istio query:
|
|
|
|
```javascript
|
|
histogram_quantile(0.99,
|
|
sum(
|
|
irate(
|
|
istio_request_duration_seconds_bucket{
|
|
reporter="destination",
|
|
destination_workload=~"$workload",
|
|
destination_workload_namespace=~"$namespace"
|
|
}[$interval]
|
|
)
|
|
) by (le)
|
|
)
|
|
```
|
|
|
|
App Mesh query:
|
|
|
|
```javascript
|
|
histogram_quantile(0.99,
|
|
sum(
|
|
irate(
|
|
envoy_cluster_upstream_rq_time_bucket{
|
|
kubernetes_pod_name=~"$workload",
|
|
kubernetes_namespace=~"$namespace"
|
|
}[$interval]
|
|
)
|
|
) by (le)
|
|
)
|
|
```
|
|
|
|
> **Note** that the metric interval should be lower or equal to the control loop interval.
|
|
|
|
### Custom Metrics
|
|
|
|
The canary analysis can be extended with custom Prometheus queries.
|
|
|
|
```yaml
|
|
canaryAnalysis:
|
|
threshold: 1
|
|
maxWeight: 50
|
|
stepWeight: 5
|
|
metrics:
|
|
- name: "404s percentage"
|
|
threshold: 5
|
|
query: |
|
|
100 - sum(
|
|
rate(
|
|
istio_requests_total{
|
|
reporter="destination",
|
|
destination_workload_namespace="test",
|
|
destination_workload="podinfo",
|
|
response_code!="404"
|
|
}[1m]
|
|
)
|
|
)
|
|
/
|
|
sum(
|
|
rate(
|
|
istio_requests_total{
|
|
reporter="destination",
|
|
destination_workload_namespace="test",
|
|
destination_workload="podinfo"
|
|
}[1m]
|
|
)
|
|
) * 100
|
|
```
|
|
|
|
The above configuration validates the canary by checking
|
|
if the HTTP 404 req/sec percentage is below 5 percent of the total traffic.
|
|
If the 404s rate reaches the 5% threshold, then the canary fails.
|
|
|
|
```yaml
|
|
canaryAnalysis:
|
|
threshold: 1
|
|
maxWeight: 50
|
|
stepWeight: 5
|
|
metrics:
|
|
- name: "rpc error rate"
|
|
threshold: 5
|
|
query: |
|
|
100 - (sum
|
|
rate(
|
|
grpc_server_handled_total{
|
|
grpc_service="my.TestService",
|
|
grpc_code!="OK"
|
|
}[1m]
|
|
)
|
|
)
|
|
/
|
|
sum(
|
|
rate(
|
|
grpc_server_started_total{
|
|
grpc_service="my.TestService"
|
|
}[1m]
|
|
)
|
|
) * 100
|
|
```
|
|
|
|
The above configuration validates the canary by checking if the percentage of
|
|
non-OK GRPC req/sec is below 5 percent of the total requests. If the non-OK
|
|
rate reaches the 5% threshold, then the canary fails.
|
|
|
|
When specifying a query, Flagger will run the promql query and convert the result to float64.
|
|
Then it compares the query result value with the metric threshold value.
|
|
|
|
### Webhooks
|
|
|
|
The canary analysis can be extended with webhooks. Flagger will call each webhook URL and
|
|
determine from the response status code (HTTP 2xx) if the canary is failing or not.
|
|
|
|
There are three types of hooks:
|
|
* Pre-rollout hooks are executed before routing traffic to canary.
|
|
The canary advancement is paused if a pre-rollout hook fails and if the number of failures reach the
|
|
threshold the canary will be rollback.
|
|
* Rollout hooks are executed during the analysis on each iteration before the metric checks.
|
|
If a rollout hook call fails the canary advancement is paused and eventfully rolled back.
|
|
* Post-rollout hooks are executed after the canary has been promoted or rolled back.
|
|
If a post rollout hook fails the error is logged.
|
|
|
|
Spec:
|
|
|
|
```yaml
|
|
canaryAnalysis:
|
|
webhooks:
|
|
- name: "smoke test"
|
|
type: pre-rollout
|
|
url: http://migration-check.db/query
|
|
timeout: 30s
|
|
metadata:
|
|
key1: "val1"
|
|
key2: "val2"
|
|
- name: "load test"
|
|
type: rollout
|
|
url: http://flagger-loadtester.test/
|
|
timeout: 15s
|
|
metadata:
|
|
cmd: "hey -z 1m -q 5 -c 2 http://podinfo-canary.test:9898/"
|
|
- name: "notify"
|
|
type: post-rollout
|
|
url: http://telegram.bot:8080/
|
|
timeout: 5s
|
|
metadata:
|
|
some: "message"
|
|
```
|
|
|
|
> **Note** that the sum of all rollout webhooks timeouts should be lower than the analysis interval.
|
|
|
|
Webhook payload (HTTP POST):
|
|
|
|
```json
|
|
{
|
|
"name": "podinfo",
|
|
"namespace": "test",
|
|
"phase": "Progressing",
|
|
"metadata": {
|
|
"test": "all",
|
|
"token": "16688eb5e9f289f1991c"
|
|
}
|
|
}
|
|
```
|
|
|
|
Response status codes:
|
|
|
|
* 200-202 - advance canary by increasing the traffic weight
|
|
* timeout or non-2xx - halt advancement and increment failed checks
|
|
|
|
On a non-2xx response Flagger will include the response body (if any) in the failed checks log and Kubernetes events.
|
|
|
|
### Load Testing
|
|
|
|
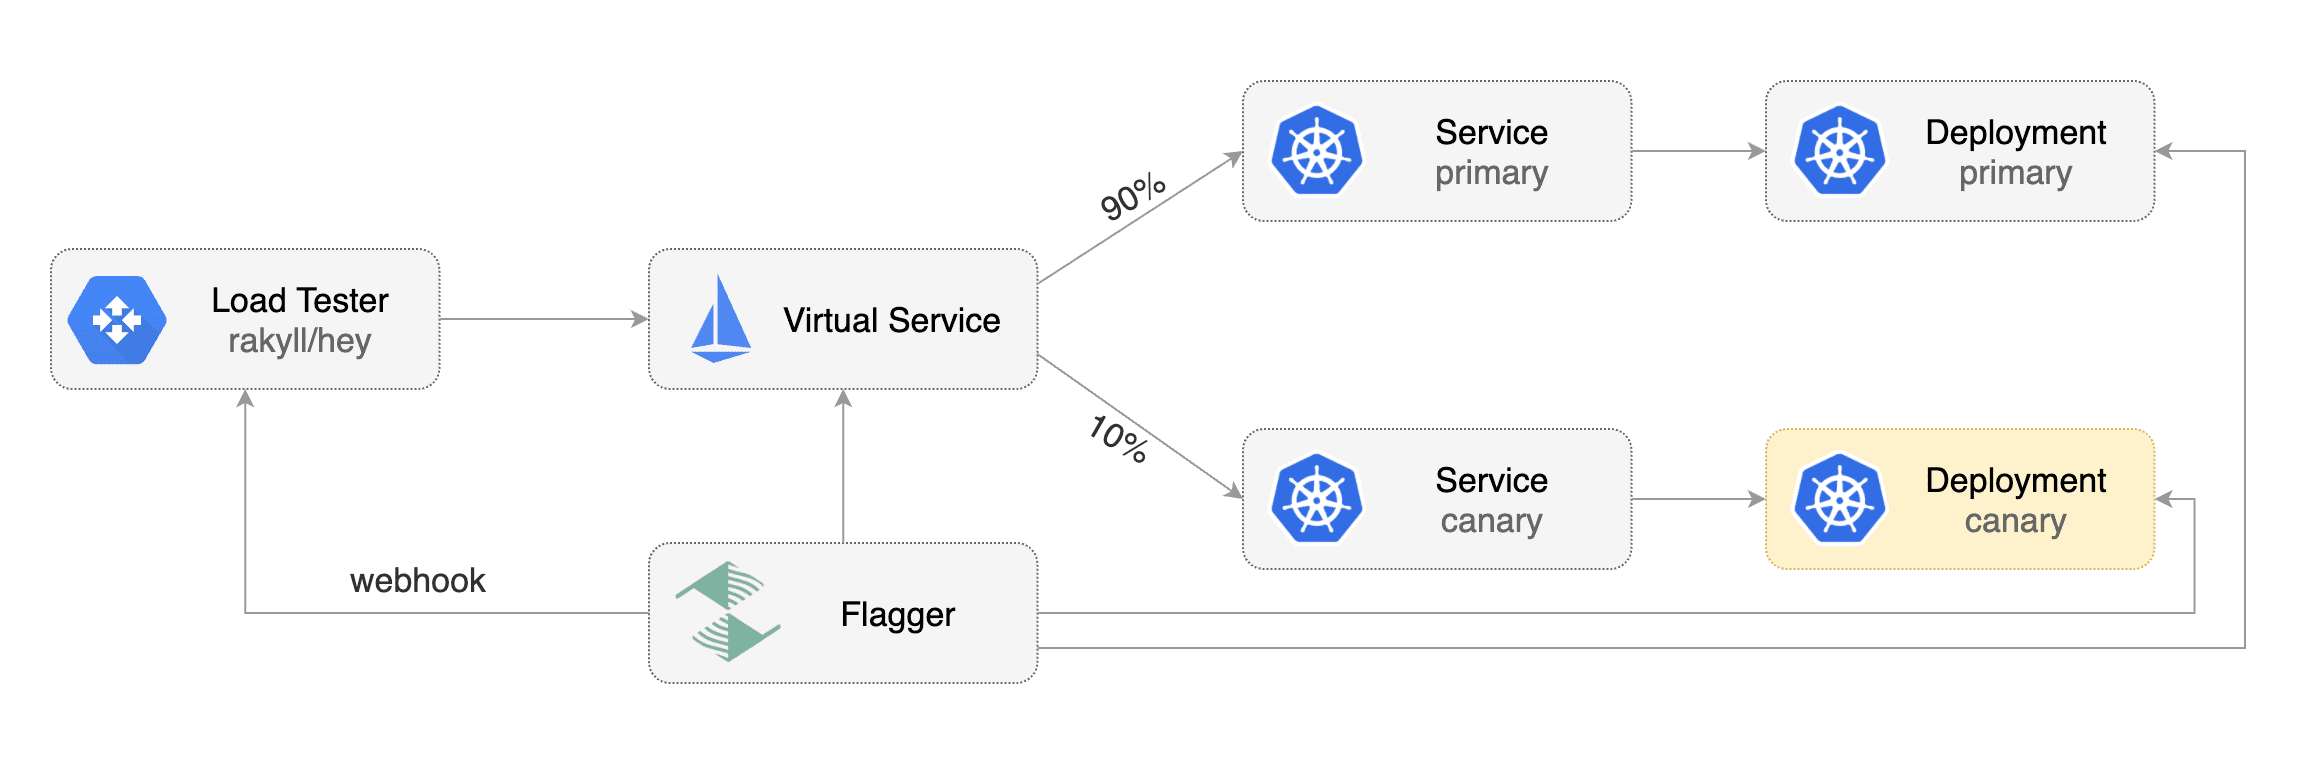
For workloads that are not receiving constant traffic Flagger can be configured with a webhook,
|
|
that when called, will start a load test for the target workload.
|
|
If the target workload doesn't receive any traffic during the canary analysis,
|
|
Flagger metric checks will fail with "no values found for metric istio_requests_total".
|
|
|
|
Flagger comes with a load testing service based on [rakyll/hey](https://github.com/rakyll/hey)
|
|
that generates traffic during analysis when configured as a webhook.
|
|
|
|
|
|
|
|
First you need to deploy the load test runner in a namespace with Istio sidecar injection enabled:
|
|
|
|
```bash
|
|
export REPO=https://raw.githubusercontent.com/weaveworks/flagger/master
|
|
|
|
kubectl -n test apply -f ${REPO}/artifacts/loadtester/deployment.yaml
|
|
kubectl -n test apply -f ${REPO}/artifacts/loadtester/service.yaml
|
|
```
|
|
|
|
Or by using Helm:
|
|
|
|
```bash
|
|
helm repo add flagger https://flagger.app
|
|
|
|
helm upgrade -i flagger-loadtester flagger/loadtester \
|
|
--namespace=test \
|
|
--set cmd.timeout=1h
|
|
```
|
|
|
|
When deployed the load tester API will be available at `http://flagger-loadtester.test/`.
|
|
|
|
Now you can add webhooks to the canary analysis spec:
|
|
|
|
```yaml
|
|
webhooks:
|
|
- name: load-test-get
|
|
url: http://flagger-loadtester.test/
|
|
timeout: 5s
|
|
metadata:
|
|
type: cmd
|
|
cmd: "hey -z 1m -q 10 -c 2 http://podinfo.test:9898/"
|
|
- name: load-test-post
|
|
url: http://flagger-loadtester.test/
|
|
timeout: 5s
|
|
metadata:
|
|
type: cmd
|
|
cmd: "hey -z 1m -q 10 -c 2 -m POST -d '{test: 2}' http://podinfo.test:9898/echo"
|
|
```
|
|
|
|
When the canary analysis starts, Flagger will call the webhooks and the load tester will run the `hey` commands
|
|
in the background, if they are not already running. This will ensure that during the
|
|
analysis, the `podinfo.test` virtual service will receive a steady stream of GET and POST requests.
|
|
|
|
If your workload is exposed outside the mesh with the Istio Gateway and TLS you can point `hey` to the
|
|
public URL and use HTTP2.
|
|
|
|
```yaml
|
|
webhooks:
|
|
- name: load-test-get
|
|
url: http://flagger-loadtester.test/
|
|
timeout: 5s
|
|
metadata:
|
|
type: cmd
|
|
cmd: "hey -z 1m -q 10 -c 2 -h2 https://podinfo.example.com/"
|
|
```
|
|
|
|
The load tester can run arbitrary commands as long as the binary is present in the container image.
|
|
For example if you you want to replace `hey` with another CLI, you can create your own Docker image:
|
|
|
|
```dockerfile
|
|
FROM quay.io/stefanprodan/flagger-loadtester:<VER>
|
|
|
|
RUN curl -Lo /usr/local/bin/my-cli https://github.com/user/repo/releases/download/ver/my-cli \
|
|
&& chmod +x /usr/local/bin/my-cli
|
|
```
|
|
|
|
### Load Testing Delegation
|
|
|
|
The load tester can also forward testing tasks to external tools, by now [nGrinder](https://github.com/naver/ngrinder)
|
|
is supported.
|
|
|
|
To use this feature, add a load test task of type 'ngrinder' to the canary analysis spec:
|
|
|
|
```yaml
|
|
webhooks:
|
|
- name: load-test-post
|
|
url: http://flagger-loadtester.test/
|
|
timeout: 5s
|
|
metadata:
|
|
# type of this load test task, cmd or ngrinder
|
|
type: ngrinder
|
|
# base url of your nGrinder controller server
|
|
server: http://ngrinder-server:port
|
|
# id of the test to clone from, the test must have been defined.
|
|
clone: 100
|
|
# user name and base64 encoded password to authenticate against the nGrinder server
|
|
username: admin
|
|
passwd: YWRtaW4=
|
|
# the interval between between nGrinder test status polling, default to 1s
|
|
pollInterval: 5s
|
|
```
|
|
When the canary analysis starts, the load tester will initiate a [clone_and_start request](https://github.com/naver/ngrinder/wiki/REST-API-PerfTest)
|
|
to the nGrinder server and start a new performance test. the load tester will periodically poll the nGrinder server
|
|
for the status of the test, and prevent duplicate requests from being sent in subsequent analysis loops.
|