mirror of
https://github.com/fluxcd/flagger.git
synced 2026-04-15 06:57:34 +00:00

297 lines
8.3 KiB
Markdown
297 lines
8.3 KiB
Markdown
# Flagger SMI
|
||
|
||
This guide shows you how to use the SMI Istio adapter and Flagger to automate canary deployments.
|
||
|
||
### Prerequisites
|
||
|
||
* Kubernetes > 1.13
|
||
* Istio > 1.0
|
||
|
||
### Install Istio SMI adapter
|
||
|
||
Install the SMI adapter:
|
||
|
||
```bash
|
||
kubectl apply -f https://raw.githubusercontent.com/deislabs/smi-adapter-istio/master/deploy/crds/crds.yaml
|
||
kubectl apply -f https://raw.githubusercontent.com/deislabs/smi-adapter-istio/master/deploy/operator-and-rbac.yaml
|
||
```
|
||
|
||
Create a generic Istio gateway to expose services outside the mesh on HTTP:
|
||
|
||
```yaml
|
||
apiVersion: networking.istio.io/v1alpha3
|
||
kind: Gateway
|
||
metadata:
|
||
name: public-gateway
|
||
namespace: istio-system
|
||
spec:
|
||
selector:
|
||
istio: ingressgateway
|
||
servers:
|
||
- port:
|
||
number: 80
|
||
name: http
|
||
protocol: HTTP
|
||
hosts:
|
||
- "*"
|
||
```
|
||
|
||
Save the above resource as public-gateway.yaml and then apply it:
|
||
|
||
```bash
|
||
kubectl apply -f ./public-gateway.yaml
|
||
```
|
||
|
||
Find the Gateway load balancer IP and add a DNS record for it:
|
||
|
||
```bash
|
||
kubectl -n istio-system get svc/istio-ingressgateway -ojson | jq -r .status.loadBalancer.ingress[0].ip
|
||
```
|
||
|
||
### Install Flagger and Grafana
|
||
|
||
Add Flagger Helm repository:
|
||
|
||
```bash
|
||
helm repo add flagger https://flagger.app
|
||
```
|
||
|
||
Deploy Flagger in the _**istio-system**_ namespace:
|
||
|
||
```bash
|
||
helm upgrade -i flagger flagger/flagger \
|
||
--namespace=istio-system \
|
||
--set meshProvider=smi:istio
|
||
```
|
||
|
||
Flagger comes with a Grafana dashboard made for monitoring the canary deployments.
|
||
|
||
Deploy Grafana in the _**istio-system**_ namespace:
|
||
|
||
```bash
|
||
helm upgrade -i flagger-grafana flagger/grafana \
|
||
--namespace=istio-system \
|
||
--set url=http://prometheus.istio-system:9090
|
||
```
|
||
|
||
You can access Grafana using port forwarding:
|
||
|
||
```bash
|
||
kubectl -n istio-system port-forward svc/flagger-grafana 3000:80
|
||
```
|
||
|
||
### Workloads bootstrap
|
||
|
||
Create a test namespace with Istio sidecar injection enabled:
|
||
|
||
Create a test namespace and enable Linkerd proxy injection:
|
||
|
||
```bash
|
||
kubectl create ns test
|
||
kubectl label namespace test istio-injection=enabled
|
||
```
|
||
|
||
Create a deployment and a horizontal pod autoscaler:
|
||
|
||
```bash
|
||
kubectl apply -k github.com/weaveworks/flagger//kustomize/podinfo
|
||
```
|
||
|
||
Deploy the load testing service to generate traffic during the canary analysis:
|
||
|
||
```bash
|
||
kubectl apply -k github.com/weaveworks/flagger//kustomize/tester
|
||
```
|
||
|
||
Create a canary custom resource (replace example.com with your own domain):
|
||
|
||
```yaml
|
||
apiVersion: flagger.app/v1alpha3
|
||
kind: Canary
|
||
metadata:
|
||
name: podinfo
|
||
namespace: test
|
||
spec:
|
||
# deployment reference
|
||
targetRef:
|
||
apiVersion: apps/v1
|
||
kind: Deployment
|
||
name: podinfo
|
||
# the maximum time in seconds for the canary deployment
|
||
# to make progress before it is rollback (default 600s)
|
||
progressDeadlineSeconds: 60
|
||
# HPA reference (optional)
|
||
autoscalerRef:
|
||
apiVersion: autoscaling/v2beta1
|
||
kind: HorizontalPodAutoscaler
|
||
name: podinfo
|
||
service:
|
||
# container port
|
||
port: 9898
|
||
# Istio gateways (optional)
|
||
gateways:
|
||
- public-gateway.istio-system.svc.cluster.local
|
||
# Istio virtual service host names (optional)
|
||
hosts:
|
||
- app.example.com
|
||
canaryAnalysis:
|
||
# schedule interval (default 60s)
|
||
interval: 10s
|
||
# max number of failed metric checks before rollback
|
||
threshold: 5
|
||
# max traffic percentage routed to canary
|
||
# percentage (0-100)
|
||
maxWeight: 50
|
||
# canary increment step
|
||
# percentage (0-100)
|
||
stepWeight: 10
|
||
metrics:
|
||
- name: request-success-rate
|
||
# minimum req success rate (non 5xx responses)
|
||
# percentage (0-100)
|
||
threshold: 99
|
||
interval: 1m
|
||
- name: request-duration
|
||
# maximum req duration P99
|
||
# milliseconds
|
||
threshold: 500
|
||
interval: 30s
|
||
# generate traffic during analysis
|
||
webhooks:
|
||
- name: load-test
|
||
url: http://flagger-loadtester.test/
|
||
timeout: 5s
|
||
metadata:
|
||
cmd: "hey -z 1m -q 10 -c 2 http://podinfo.test:9898/"
|
||
```
|
||
|
||
Save the above resource as podinfo-canary.yaml and then apply it:
|
||
|
||
```bash
|
||
kubectl apply -f ./podinfo-canary.yaml
|
||
```
|
||
|
||
After a couple of seconds Flagger will create the canary objects:
|
||
|
||
```bash
|
||
# applied
|
||
deployment.apps/podinfo
|
||
horizontalpodautoscaler.autoscaling/podinfo
|
||
canary.flagger.app/podinfo
|
||
|
||
# generated
|
||
deployment.apps/podinfo-primary
|
||
horizontalpodautoscaler.autoscaling/podinfo-primary
|
||
service/podinfo
|
||
service/podinfo-canary
|
||
service/podinfo-primary
|
||
trafficsplits.split.smi-spec.io/podinfo
|
||
```
|
||
|
||
### Automated canary promotion
|
||
|
||
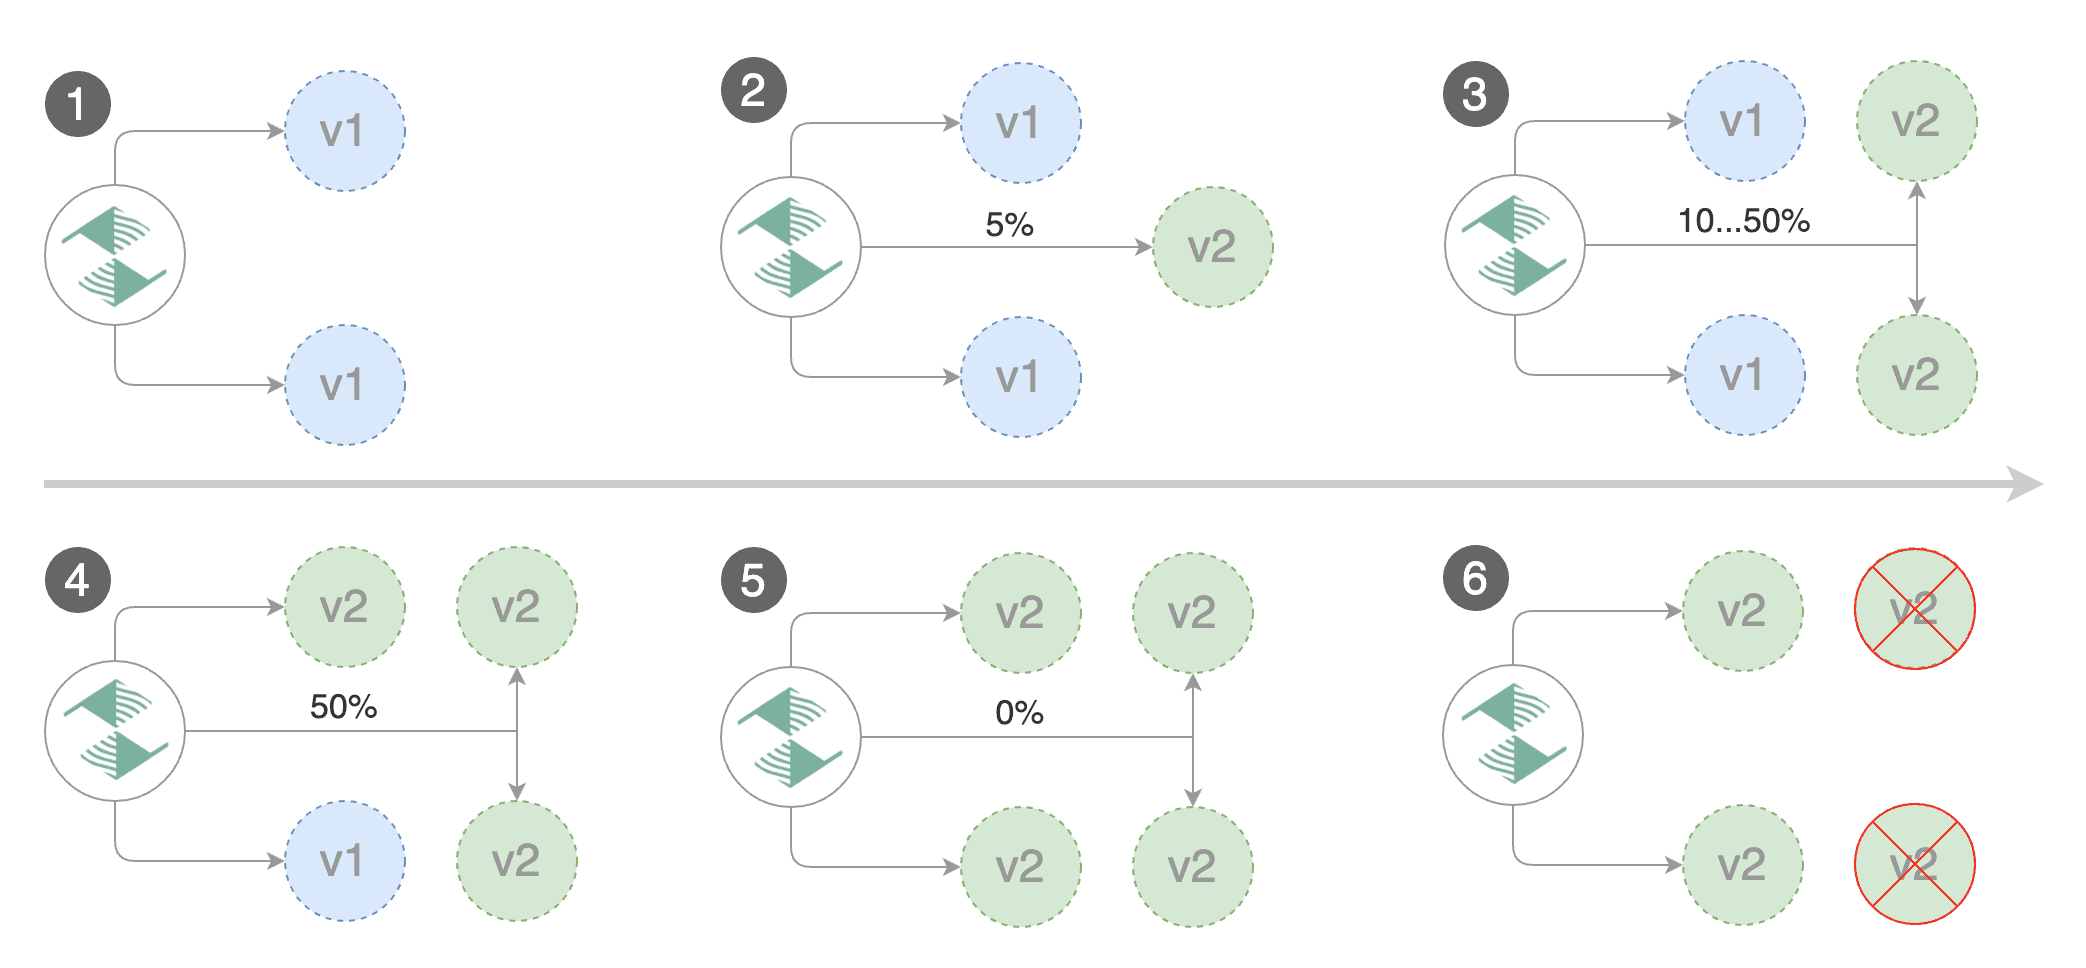
Flagger implements a control loop that gradually shifts traffic to the canary while measuring key performance indicators
|
||
like HTTP requests success rate, requests average duration and pod health.
|
||
Based on analysis of the KPIs a canary is promoted or aborted, and the analysis result is published to Slack.
|
||
|
||
|
||
|
||
Trigger a canary deployment by updating the container image:
|
||
|
||
```bash
|
||
kubectl -n test set image deployment/podinfo \
|
||
podinfod=quay.io/stefanprodan/podinfo:3.1.1
|
||
```
|
||
|
||
Flagger detects that the deployment revision changed and starts a new rollout:
|
||
|
||
```text
|
||
kubectl -n istio-system logs deployment/flagger -f | jq .msg
|
||
|
||
|
||
New revision detected podinfo.test
|
||
Scaling up podinfo.test
|
||
Waiting for podinfo.test rollout to finish: 0 of 1 updated replicas are available
|
||
Advance podinfo.test canary weight 5
|
||
Advance podinfo.test canary weight 10
|
||
Advance podinfo.test canary weight 15
|
||
Advance podinfo.test canary weight 20
|
||
Advance podinfo.test canary weight 25
|
||
Advance podinfo.test canary weight 30
|
||
Advance podinfo.test canary weight 35
|
||
Advance podinfo.test canary weight 40
|
||
Advance podinfo.test canary weight 45
|
||
Advance podinfo.test canary weight 50
|
||
Copying podinfo.test template spec to podinfo-primary.test
|
||
Waiting for podinfo-primary.test rollout to finish: 1 of 2 updated replicas are available
|
||
Promotion completed! Scaling down podinfo.test
|
||
```
|
||
|
||
**Note** that if you apply new changes to the deployment during the canary analysis, Flagger will restart the analysis.
|
||
|
||
During the analysis the canary’s progress can be monitored with Grafana. The Istio dashboard URL is
|
||
http://localhost:3000/d/flagger-istio/istio-canary?refresh=10s&orgId=1&var-namespace=test&var-primary=podinfo-primary&var-canary=podinfo
|
||
|
||
You can monitor all canaries with:
|
||
|
||
```bash
|
||
watch kubectl get canaries --all-namespaces
|
||
|
||
NAMESPACE NAME STATUS WEIGHT LASTTRANSITIONTIME
|
||
test podinfo Progressing 15 2019-05-16T14:05:07Z
|
||
prod frontend Succeeded 0 2019-05-15T16:15:07Z
|
||
prod backend Failed 0 2019-05-14T17:05:07Z
|
||
```
|
||
|
||
### Automated rollback
|
||
|
||
During the canary analysis you can generate HTTP 500 errors and high latency to test if Flagger pauses the rollout.
|
||
|
||
Create a tester pod and exec into it:
|
||
|
||
```bash
|
||
kubectl -n test run tester \
|
||
--image=quay.io/stefanprodan/podinfo:3.1.2 \
|
||
-- ./podinfo --port=9898
|
||
|
||
kubectl -n test exec -it tester-xx-xx sh
|
||
```
|
||
|
||
Generate HTTP 500 errors:
|
||
|
||
```bash
|
||
watch curl http://podinfo-canary:9898/status/500
|
||
```
|
||
|
||
Generate latency:
|
||
|
||
```bash
|
||
watch curl http://podinfo-canary:9898/delay/1
|
||
```
|
||
|
||
When the number of failed checks reaches the canary analysis threshold, the traffic is routed back to the primary,
|
||
the canary is scaled to zero and the rollout is marked as failed.
|
||
|
||
```text
|
||
kubectl -n test describe canary/podinfo
|
||
|
||
Status:
|
||
Canary Weight: 0
|
||
Failed Checks: 10
|
||
Phase: Failed
|
||
Events:
|
||
Type Reason Age From Message
|
||
---- ------ ---- ---- -------
|
||
Normal Synced 3m flagger Starting canary deployment for podinfo.test
|
||
Normal Synced 3m flagger Advance podinfo.test canary weight 5
|
||
Normal Synced 3m flagger Advance podinfo.test canary weight 10
|
||
Normal Synced 3m flagger Advance podinfo.test canary weight 15
|
||
Normal Synced 3m flagger Halt podinfo.test advancement success rate 69.17% < 99%
|
||
Normal Synced 2m flagger Halt podinfo.test advancement success rate 61.39% < 99%
|
||
Normal Synced 2m flagger Halt podinfo.test advancement success rate 55.06% < 99%
|
||
Normal Synced 2m flagger Halt podinfo.test advancement success rate 47.00% < 99%
|
||
Normal Synced 2m flagger (combined from similar events): Halt podinfo.test advancement success rate 38.08% < 99%
|
||
Warning Synced 1m flagger Rolling back podinfo.test failed checks threshold reached 10
|
||
Warning Synced 1m flagger Canary failed! Scaling down podinfo.test
|
||
```
|