mirror of
https://github.com/fluxcd/flagger.git
synced 2026-04-15 06:57:34 +00:00

247 lines
6.5 KiB
Markdown
247 lines
6.5 KiB
Markdown
# How it works
|
|
|
|
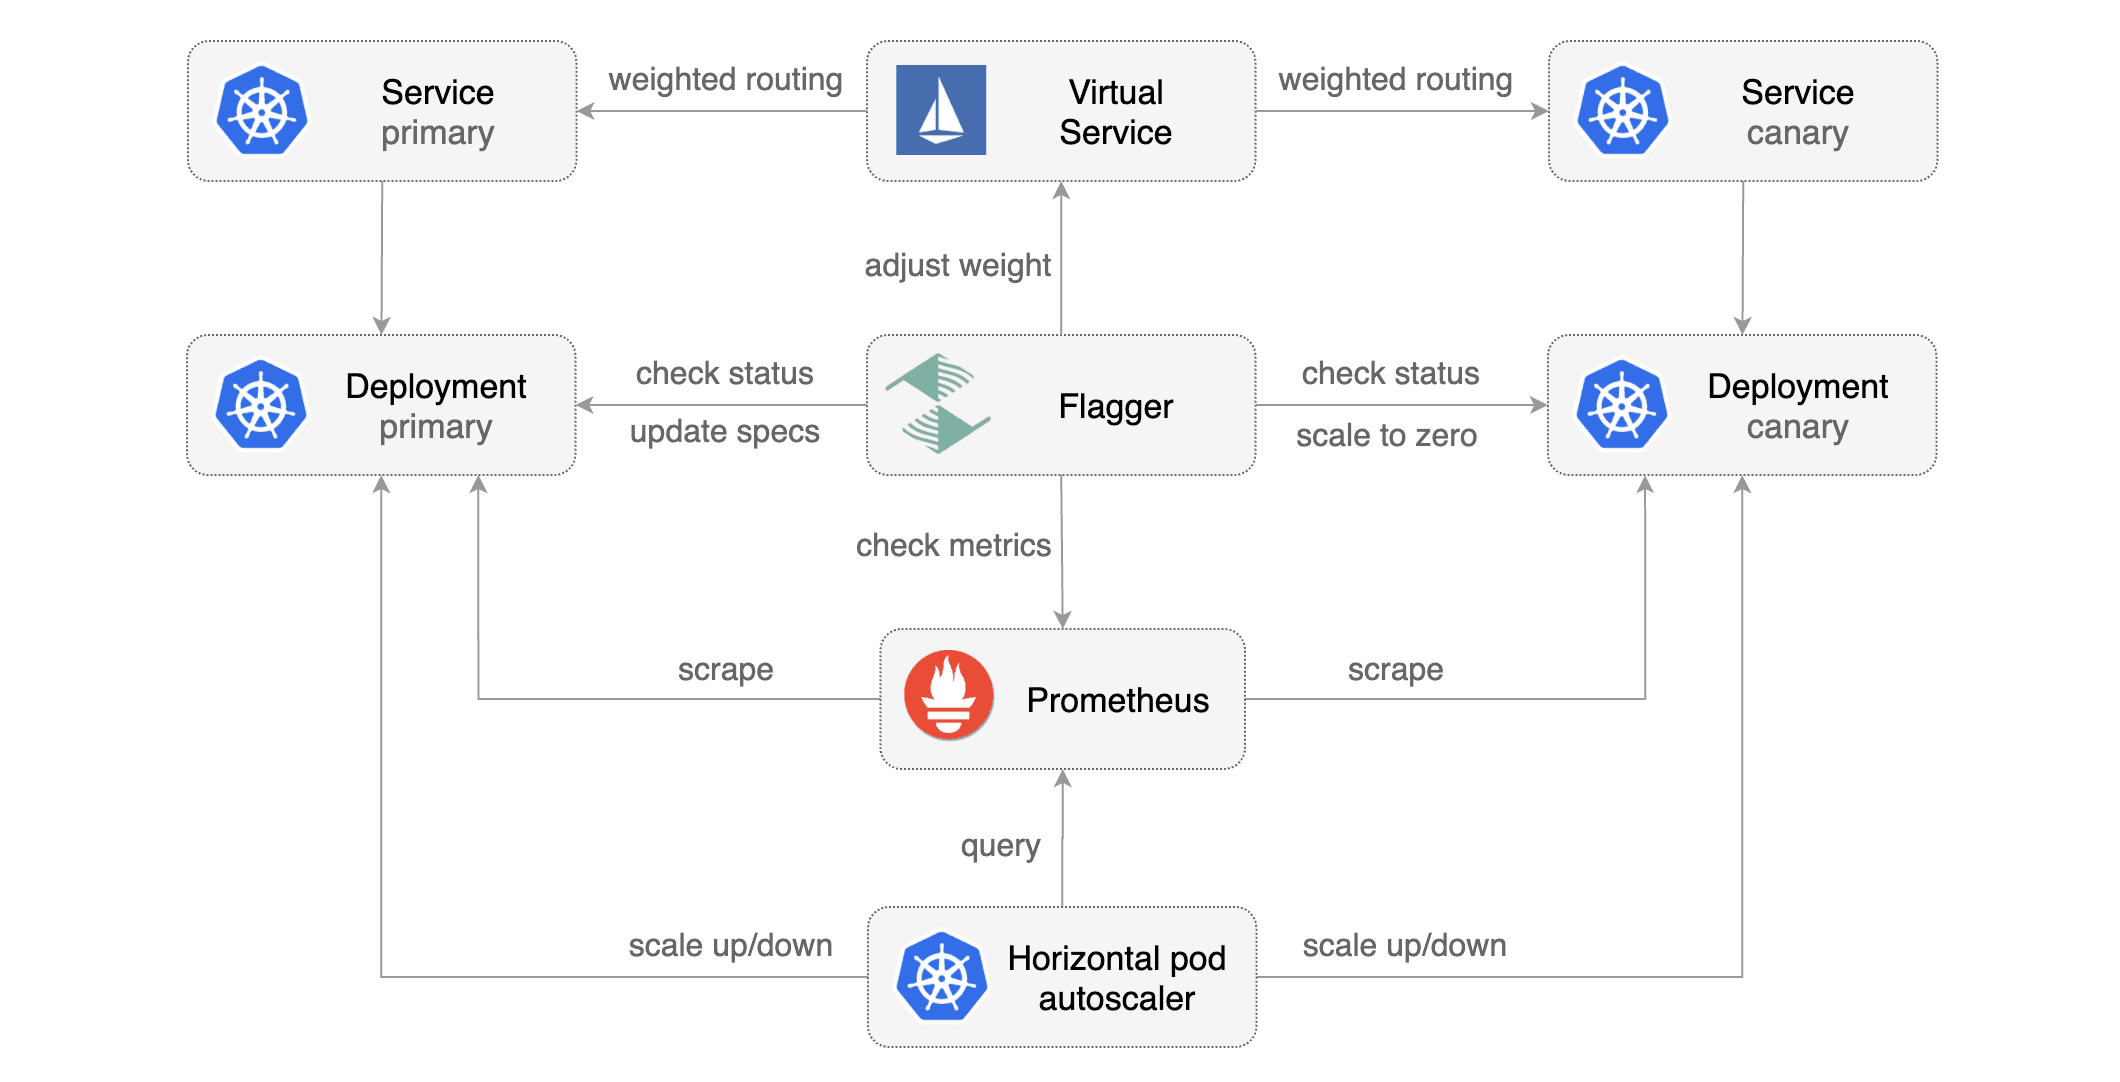
[Flagger](https://github.com/stefanprodan/flagger) takes a Kubernetes deployment and optionally a horizontal pod autoscaler \(HPA\) and creates a series of objects \(Kubernetes deployments, ClusterIP services and Istio virtual services\) to drive the canary analysis and promotion.
|
|
|
|
|
|
|
|
### Canary Custom Resource
|
|
|
|
For a deployment named _podinfo_, a canary promotion can be defined using Flagger's custom resource:
|
|
|
|
```yaml
|
|
apiVersion: flagger.app/v1alpha2
|
|
kind: Canary
|
|
metadata:
|
|
name: podinfo
|
|
namespace: test
|
|
spec:
|
|
# deployment reference
|
|
targetRef:
|
|
apiVersion: apps/v1
|
|
kind: Deployment
|
|
name: podinfo
|
|
# the maximum time in seconds for the canary deployment
|
|
# to make progress before it is rollback (default 600s)
|
|
progressDeadlineSeconds: 60
|
|
# HPA reference (optional)
|
|
autoscalerRef:
|
|
apiVersion: autoscaling/v2beta1
|
|
kind: HorizontalPodAutoscaler
|
|
name: podinfo
|
|
service:
|
|
# container port
|
|
port: 9898
|
|
# Istio gateways (optional)
|
|
gateways:
|
|
- public-gateway.istio-system.svc.cluster.local
|
|
# Istio virtual service host names (optional)
|
|
hosts:
|
|
- app.iowa.weavedx.com
|
|
canaryAnalysis:
|
|
# max number of failed metric checks before rollback
|
|
threshold: 10
|
|
# max traffic percentage routed to canary
|
|
# percentage (0-100)
|
|
maxWeight: 50
|
|
# canary increment step
|
|
# percentage (0-100)
|
|
stepWeight: 5
|
|
# Istio Prometheus checks
|
|
metrics:
|
|
- name: istio_requests_total
|
|
# minimum req success rate (non 5xx responses)
|
|
# percentage (0-100)
|
|
threshold: 99
|
|
interval: 1m
|
|
- name: istio_request_duration_seconds_bucket
|
|
# maximum req duration P99
|
|
# milliseconds
|
|
threshold: 500
|
|
interval: 30s
|
|
# external checks (optional)
|
|
webhooks:
|
|
- name: integration-tests
|
|
url: http://podinfo.test:9898/echo
|
|
timeout: 1m
|
|
metadata:
|
|
test: "all"
|
|
token: "16688eb5e9f289f1991c"
|
|
```
|
|
|
|
### Canary Deployment
|
|
|
|
|
|
|
|
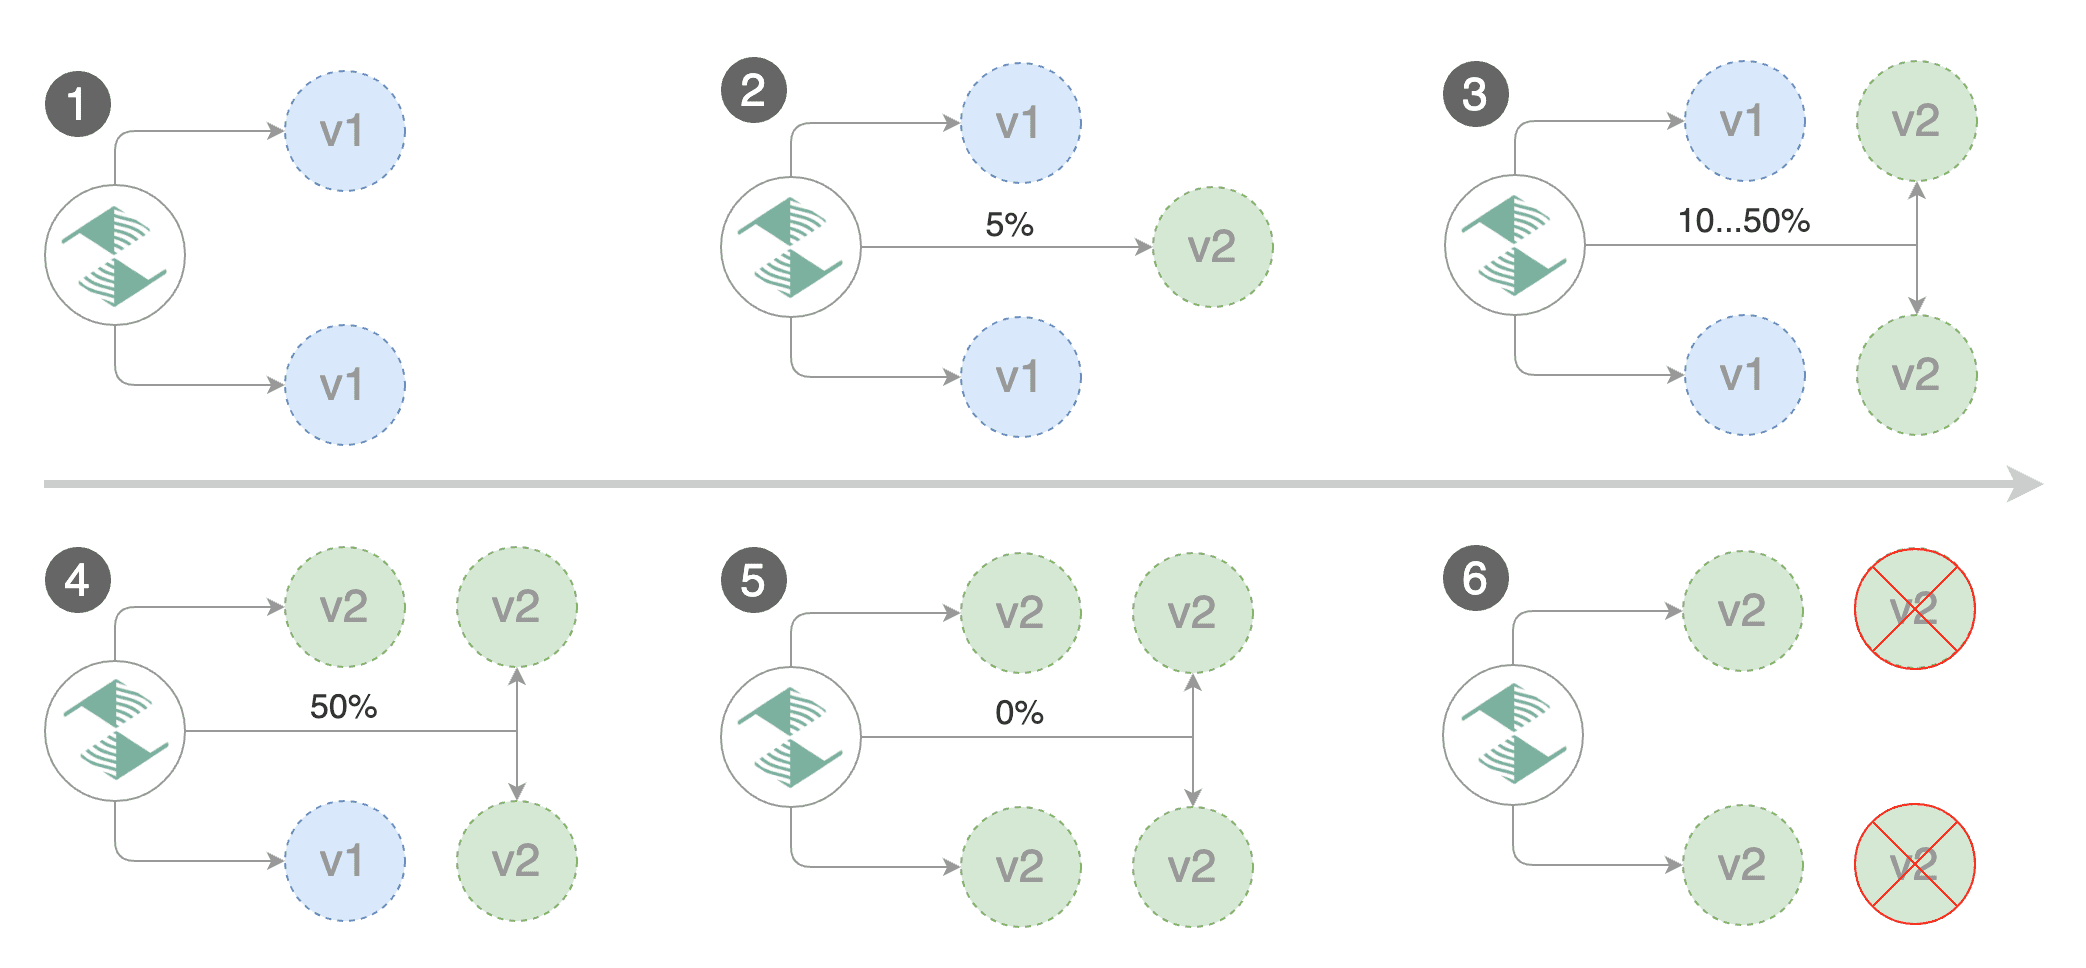
Gated canary promotion stages:
|
|
|
|
* scan for canary deployments
|
|
* creates the primary deployment if needed
|
|
* check Istio virtual service routes are mapped to primary and canary ClusterIP services
|
|
* check primary and canary deployments status
|
|
* halt advancement if a rolling update is underway
|
|
* halt advancement if pods are unhealthy
|
|
* increase canary traffic weight percentage from 0% to 5% \(step weight\)
|
|
* check canary HTTP request success rate and latency
|
|
* halt advancement if any metric is under the specified threshold
|
|
* increment the failed checks counter
|
|
* check if the number of failed checks reached the threshold
|
|
* route all traffic to primary
|
|
* scale to zero the canary deployment and mark it as failed
|
|
* wait for the canary deployment to be updated \(revision bump\) and start over
|
|
* increase canary traffic weight by 5% \(step weight\) till it reaches 50% \(max weight\)
|
|
* halt advancement while canary request success rate is under the threshold
|
|
* halt advancement while canary request duration P99 is over the threshold
|
|
* halt advancement if the primary or canary deployment becomes unhealthy
|
|
* halt advancement while canary deployment is being scaled up/down by HPA
|
|
* promote canary to primary
|
|
* copy canary deployment spec template over primary
|
|
* wait for primary rolling update to finish
|
|
* halt advancement if pods are unhealthy
|
|
* route all traffic to primary
|
|
* scale to zero the canary deployment
|
|
* mark rollout as finished
|
|
* wait for the canary deployment to be updated \(revision bump\) and start over
|
|
|
|
You can change the canary analysis _max weight_ and the _step weight_ percentage in the Flagger's custom resource.
|
|
|
|
### Canary Analysis
|
|
|
|
Spec:
|
|
|
|
```yaml
|
|
canaryAnalysis:
|
|
# max number of failed metric checks before rollback
|
|
threshold: 10
|
|
# max traffic percentage routed to canary
|
|
# percentage (0-100)
|
|
maxWeight: 50
|
|
# canary increment step
|
|
# percentage (0-100)
|
|
stepWeight: 5
|
|
```
|
|
|
|
You can determine the minimum time that it takes to validate and promote a canary deployment using this formula:
|
|
|
|
```
|
|
controlLoopInterval * (maxWeight / stepWeight)
|
|
```
|
|
|
|
And the time it takes for a canary to be rollback:
|
|
|
|
```
|
|
controlLoopInterval * threshold
|
|
```
|
|
|
|
### HTTP Metrics
|
|
|
|
The canary analysis is using the following Prometheus queries:
|
|
|
|
**HTTP requests success rate percentage**
|
|
|
|
Spec:
|
|
|
|
```yaml
|
|
canaryAnalysis:
|
|
metrics:
|
|
- name: istio_requests_total
|
|
# minimum req success rate (non 5xx responses)
|
|
# percentage (0-100)
|
|
threshold: 99
|
|
interval: 1m
|
|
```
|
|
|
|
Query:
|
|
|
|
```javascript
|
|
sum(
|
|
rate(
|
|
istio_requests_total{
|
|
reporter="destination",
|
|
destination_workload_namespace=~"$namespace",
|
|
destination_workload=~"$workload",
|
|
response_code!~"5.*"
|
|
}[$interval]
|
|
)
|
|
)
|
|
/
|
|
sum(
|
|
rate(
|
|
istio_requests_total{
|
|
reporter="destination",
|
|
destination_workload_namespace=~"$namespace",
|
|
destination_workload=~"$workload"
|
|
}[$interval]
|
|
)
|
|
)
|
|
```
|
|
|
|
**HTTP requests milliseconds duration P99**
|
|
|
|
Spec:
|
|
|
|
```yaml
|
|
canaryAnalysis:
|
|
metrics:
|
|
- name: istio_request_duration_seconds_bucket
|
|
# maximum req duration P99
|
|
# milliseconds
|
|
threshold: 500
|
|
interval: 1m
|
|
```
|
|
|
|
Query:
|
|
|
|
```javascript
|
|
histogram_quantile(0.99,
|
|
sum(
|
|
irate(
|
|
istio_request_duration_seconds_bucket{
|
|
reporter="destination",
|
|
destination_workload=~"$workload",
|
|
destination_workload_namespace=~"$namespace"
|
|
}[$interval]
|
|
)
|
|
) by (le)
|
|
)
|
|
```
|
|
|
|
### Webhooks
|
|
|
|
The canary analysis can be extended with webhooks.
|
|
Flagger would call a URL (HTTP POST) and determine from the response status code (HTTP 2xx) if the canary is failing or not.
|
|
|
|
Spec:
|
|
|
|
```yaml
|
|
canaryAnalysis:
|
|
webhooks:
|
|
- name: integration-tests
|
|
url: http://podinfo.test:9898/echo
|
|
timeout: 1m
|
|
metadata:
|
|
test: "all"
|
|
token: "16688eb5e9f289f1991c"
|
|
```
|
|
|
|
Webhook payload:
|
|
|
|
```json
|
|
{
|
|
"name": "podinfo",
|
|
"namespace": "test",
|
|
"metadata": {
|
|
"test": "all",
|
|
"token": "16688eb5e9f289f1991c"
|
|
}
|
|
}
|
|
```
|
|
|
|
Response status codes:
|
|
|
|
* 200-202 - advance canary by increasing the traffic weight
|
|
* timeout or non-2xx - halt advancement and increment failed checks
|
|
|
|
On a non-2xx response Flagger will include the response body (if any) in the failed checks log and Kubernetes events.
|
|
|
|
|