mirror of
https://github.com/fluxcd/flagger.git
synced 2026-02-25 23:34:21 +00:00
Compare commits
13 Commits
0.1.0-beta
...
0.1.0-beta
| Author | SHA1 | Date | |
|---|---|---|---|
|
|
3eaeec500e | ||
|
|
df98de7d11 | ||
|
|
580924e63b | ||
|
|
1b2108001f | ||
|
|
3a28768bf9 | ||
|
|
53c09f40eb | ||
|
|
074e57aa12 | ||
|
|
e16dde809d | ||
|
|
188e4ea82e | ||
|
|
4a8aa3b547 | ||
|
|
6bf4a8f95b | ||
|
|
c5ea947899 | ||
|
|
344c7db968 |
@@ -14,7 +14,9 @@ addons:
|
||||
|
||||
script:
|
||||
- set -e
|
||||
- make test
|
||||
- make test-fmt
|
||||
- make test-codegen
|
||||
- go test -race -coverprofile=coverage.txt -covermode=atomic ./pkg/controller/
|
||||
- make build
|
||||
|
||||
after_success:
|
||||
@@ -33,6 +35,8 @@ after_success:
|
||||
docker push stefanprodan/flagger:latest;
|
||||
docker push stefanprodan/flagger:$TRAVIS_TAG;
|
||||
fi
|
||||
- bash <(curl -s https://codecov.io/bash)
|
||||
- rm coverage.txt
|
||||
|
||||
deploy:
|
||||
- provider: script
|
||||
|
||||
10
Dockerfile
10
Dockerfile
@@ -13,17 +13,17 @@ RUN GIT_COMMIT=$(git rev-list -1 HEAD) && \
|
||||
|
||||
FROM alpine:3.8
|
||||
|
||||
RUN addgroup -S app \
|
||||
&& adduser -S -g app app \
|
||||
RUN addgroup -S flagger \
|
||||
&& adduser -S -g flagger flagger \
|
||||
&& apk --no-cache add ca-certificates
|
||||
|
||||
WORKDIR /home/app
|
||||
WORKDIR /home/flagger
|
||||
|
||||
COPY --from=0 /go/src/github.com/stefanprodan/flagger/flagger .
|
||||
|
||||
RUN chown -R app:app ./
|
||||
RUN chown -R flagger:flagger ./
|
||||
|
||||
USER app
|
||||
USER flagger
|
||||
|
||||
ENTRYPOINT ["./flagger"]
|
||||
|
||||
|
||||
2
Makefile
2
Makefile
@@ -4,7 +4,7 @@ VERSION_MINOR:=$(shell grep 'VERSION' pkg/version/version.go | awk '{ print $$4
|
||||
PATCH:=$(shell grep 'VERSION' pkg/version/version.go | awk '{ print $$4 }' | tr -d '"' | awk -F. '{print $$NF}')
|
||||
SOURCE_DIRS = cmd pkg/apis pkg/controller pkg/server pkg/logging pkg/version
|
||||
run:
|
||||
go run -race cmd/flagger/* -kubeconfig=$$HOME/.kube/config -log-level=info -metrics-server=https://prometheus.istio.weavedx.com
|
||||
go run cmd/flagger/* -kubeconfig=$$HOME/.kube/config -log-level=info -metrics-server=https://prometheus.iowa.weavedx.com
|
||||
|
||||
build:
|
||||
docker build -t stefanprodan/flagger:$(TAG) . -f Dockerfile
|
||||
|
||||
24
README.md
24
README.md
@@ -2,6 +2,7 @@
|
||||
|
||||
[](https://travis-ci.org/stefanprodan/flagger)
|
||||
[](https://goreportcard.com/report/github.com/stefanprodan/flagger)
|
||||
[](https://codecov.io/gh/stefanprodan/flagger)
|
||||
[](https://github.com/stefanprodan/flagger/blob/master/LICENSE)
|
||||
[](https://github.com/stefanprodan/flagger/releases)
|
||||
|
||||
@@ -329,12 +330,33 @@ Scaling down podinfo.test
|
||||
Promotion completed! podinfo.test
|
||||
```
|
||||
|
||||
Flagger exposes Prometheus metrics that can be used to determine the canary analysis status and the destination weight values:
|
||||
|
||||
```bash
|
||||
# Canaries total gauge
|
||||
flagger_canary_total{namespace="test"} 1
|
||||
|
||||
# Canary promotion last known status gauge
|
||||
# 0 - running, 1 - successful, 2 - failed
|
||||
flagger_canary_status{name="podinfo" namespace="test"} 1
|
||||
|
||||
# Canary traffic weight gauge
|
||||
flagger_canary_weight{workload="podinfo-primary" namespace="test"} 95
|
||||
flagger_canary_weight{workload="podinfo" namespace="test"} 5
|
||||
|
||||
# Seconds spent performing canary analysis histogram
|
||||
flagger_canary_duration_seconds_bucket{name="podinfo",namespace="test",le="10"} 6
|
||||
flagger_canary_duration_seconds_bucket{name="podinfo",namespace="test",le="+Inf"} 6
|
||||
flagger_canary_duration_seconds_sum{name="podinfo",namespace="test"} 17.3561329
|
||||
flagger_canary_duration_seconds_count{name="podinfo",namespace="test"} 6
|
||||
```
|
||||
|
||||
### Roadmap
|
||||
|
||||
* Extend the canary analysis and promotion to other types than Kubernetes deployments such as Flux Helm releases or OpenFaaS functions
|
||||
* Extend the validation mechanism to support other metrics than HTTP success rate and latency
|
||||
* Add support for comparing the canary metrics to the primary ones and do the validation based on the derivation between the two
|
||||
* Alerting: Trigger Alertmanager on successful or failed promotions (Prometheus instrumentation of the canary analysis)
|
||||
* Alerting: trigger Alertmanager on successful or failed promotions
|
||||
* Reporting: publish canary analysis results to Slack/Jira/etc
|
||||
|
||||
### Contributing
|
||||
|
||||
@@ -22,7 +22,7 @@ spec:
|
||||
spec:
|
||||
containers:
|
||||
- name: podinfod
|
||||
image: quay.io/stefanprodan/podinfo:1.2.1
|
||||
image: quay.io/stefanprodan/podinfo:1.3.0
|
||||
imagePullPolicy: IfNotPresent
|
||||
ports:
|
||||
- containerPort: 9898
|
||||
|
||||
@@ -22,7 +22,7 @@ spec:
|
||||
serviceAccountName: flagger
|
||||
containers:
|
||||
- name: flagger
|
||||
image: stefanprodan/flagger:0.1.0-beta.2
|
||||
image: stefanprodan/flagger:0.1.0-beta.6
|
||||
imagePullPolicy: Always
|
||||
ports:
|
||||
- name: http
|
||||
|
||||
@@ -1,6 +1,6 @@
|
||||
apiVersion: v1
|
||||
name: flagger
|
||||
version: 0.1.0
|
||||
appVersion: 0.1.0-beta.2
|
||||
appVersion: 0.1.0-beta.6
|
||||
description: Flagger is a Kubernetes operator that automates the promotion of canary deployments using Istio routing for traffic shifting and Prometheus metrics for canary analysis.
|
||||
home: https://github.com/stefanprodan/flagger
|
||||
|
||||
@@ -2,7 +2,7 @@
|
||||
|
||||
image:
|
||||
repository: stefanprodan/flagger
|
||||
tag: 0.1.0-beta.2
|
||||
tag: 0.1.0-beta.6
|
||||
pullPolicy: IfNotPresent
|
||||
|
||||
controlLoopInterval: "10s"
|
||||
|
||||
240
docs/README.md
240
docs/README.md
@@ -2,6 +2,7 @@
|
||||
|
||||
[](https://travis-ci.org/stefanprodan/flagger)
|
||||
[](https://goreportcard.com/report/github.com/stefanprodan/flagger)
|
||||
[](https://codecov.io/gh/stefanprodan/flagger)
|
||||
[](https://github.com/stefanprodan/flagger/blob/master/LICENSE)
|
||||
[](https://github.com/stefanprodan/flagger/releases)
|
||||
|
||||
@@ -19,7 +20,7 @@ Deploy Flagger in the `istio-system` namespace using Helm:
|
||||
|
||||
```bash
|
||||
# add the Helm repository
|
||||
helm repo add flagger https://stefanprodan.github.io/flagger
|
||||
helm repo add flagger https://flagger.app
|
||||
|
||||
# install or upgrade
|
||||
helm upgrade -i flagger flagger/flagger \
|
||||
@@ -32,10 +33,11 @@ Flagger is compatible with Kubernetes >1.10.0 and Istio >1.0.0.
|
||||
|
||||
### Usage
|
||||
|
||||
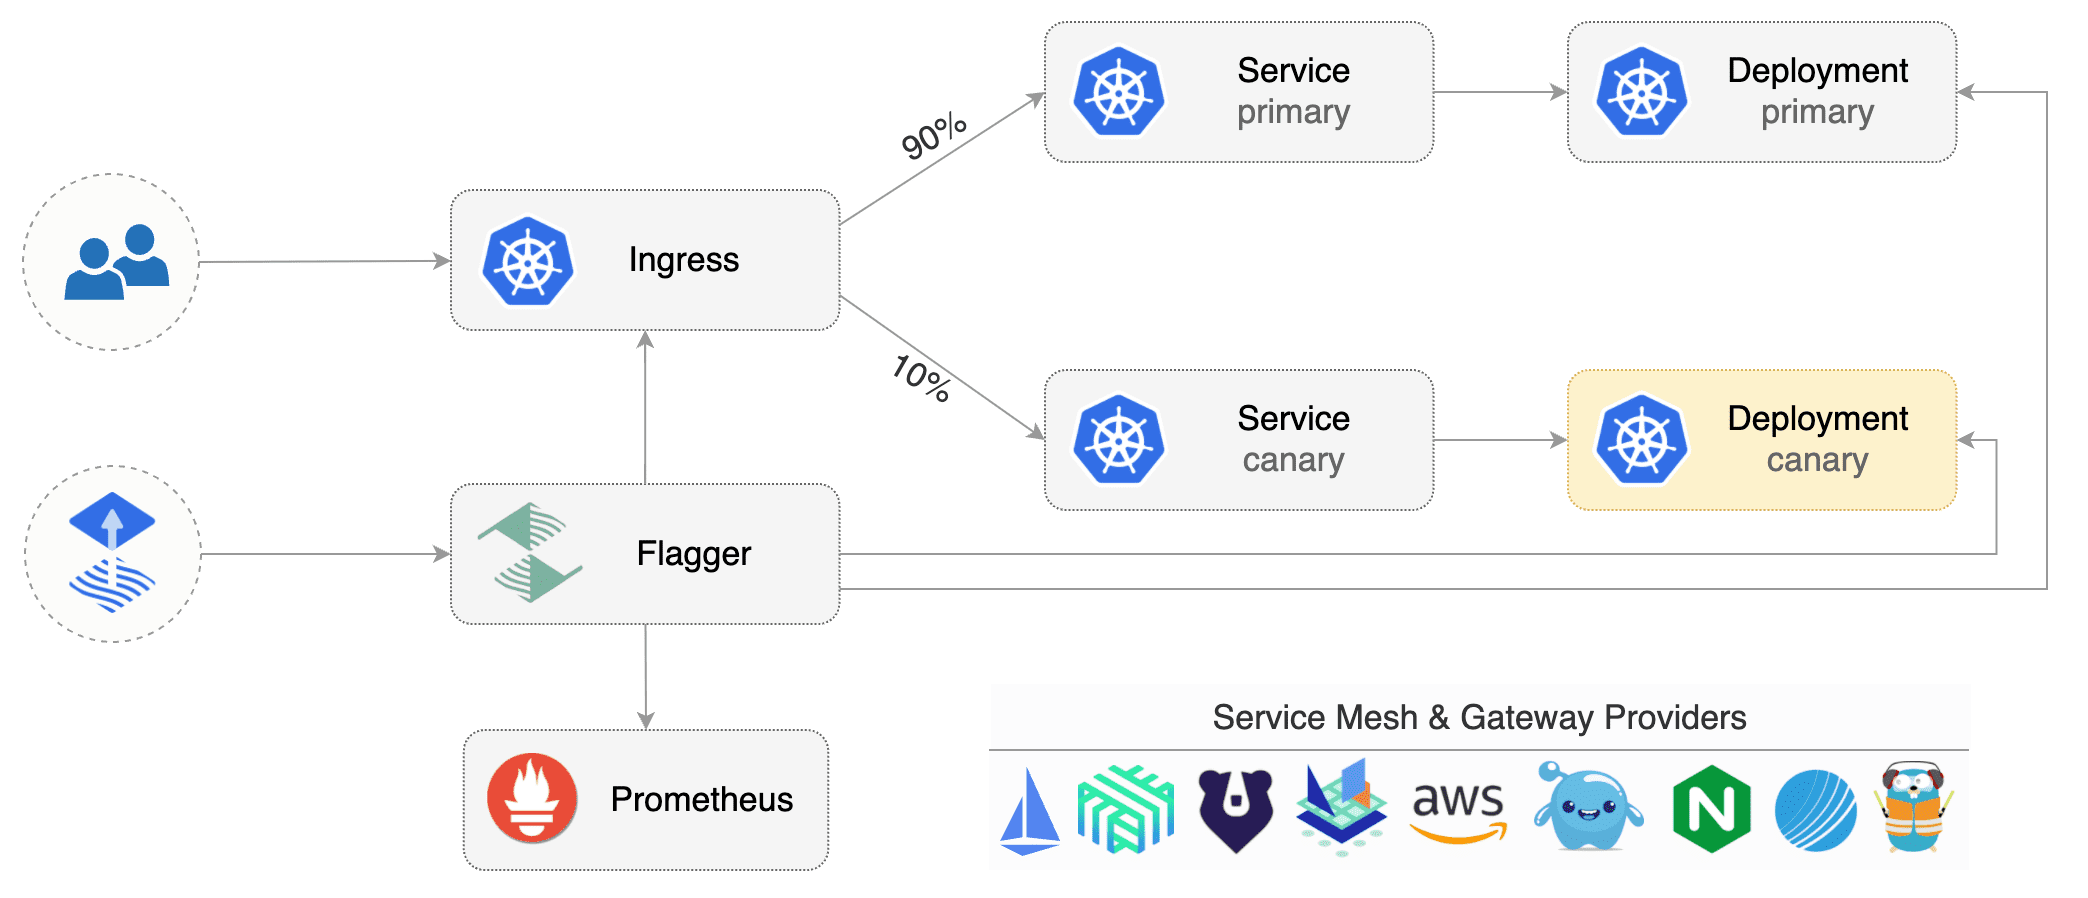
Flagger requires two Kubernetes [deployments](https://kubernetes.io/docs/concepts/workloads/controllers/deployment/):
|
||||
one for the version you want to upgrade called _primary_ and one for the _canary_.
|
||||
Each deployment must have a corresponding ClusterIP [service](https://kubernetes.io/docs/concepts/services-networking/service/)
|
||||
that exposes a port named http or https. These services are used as destinations in a Istio [virtual service](https://istio.io/docs/reference/config/istio.networking.v1alpha3/#VirtualService).
|
||||
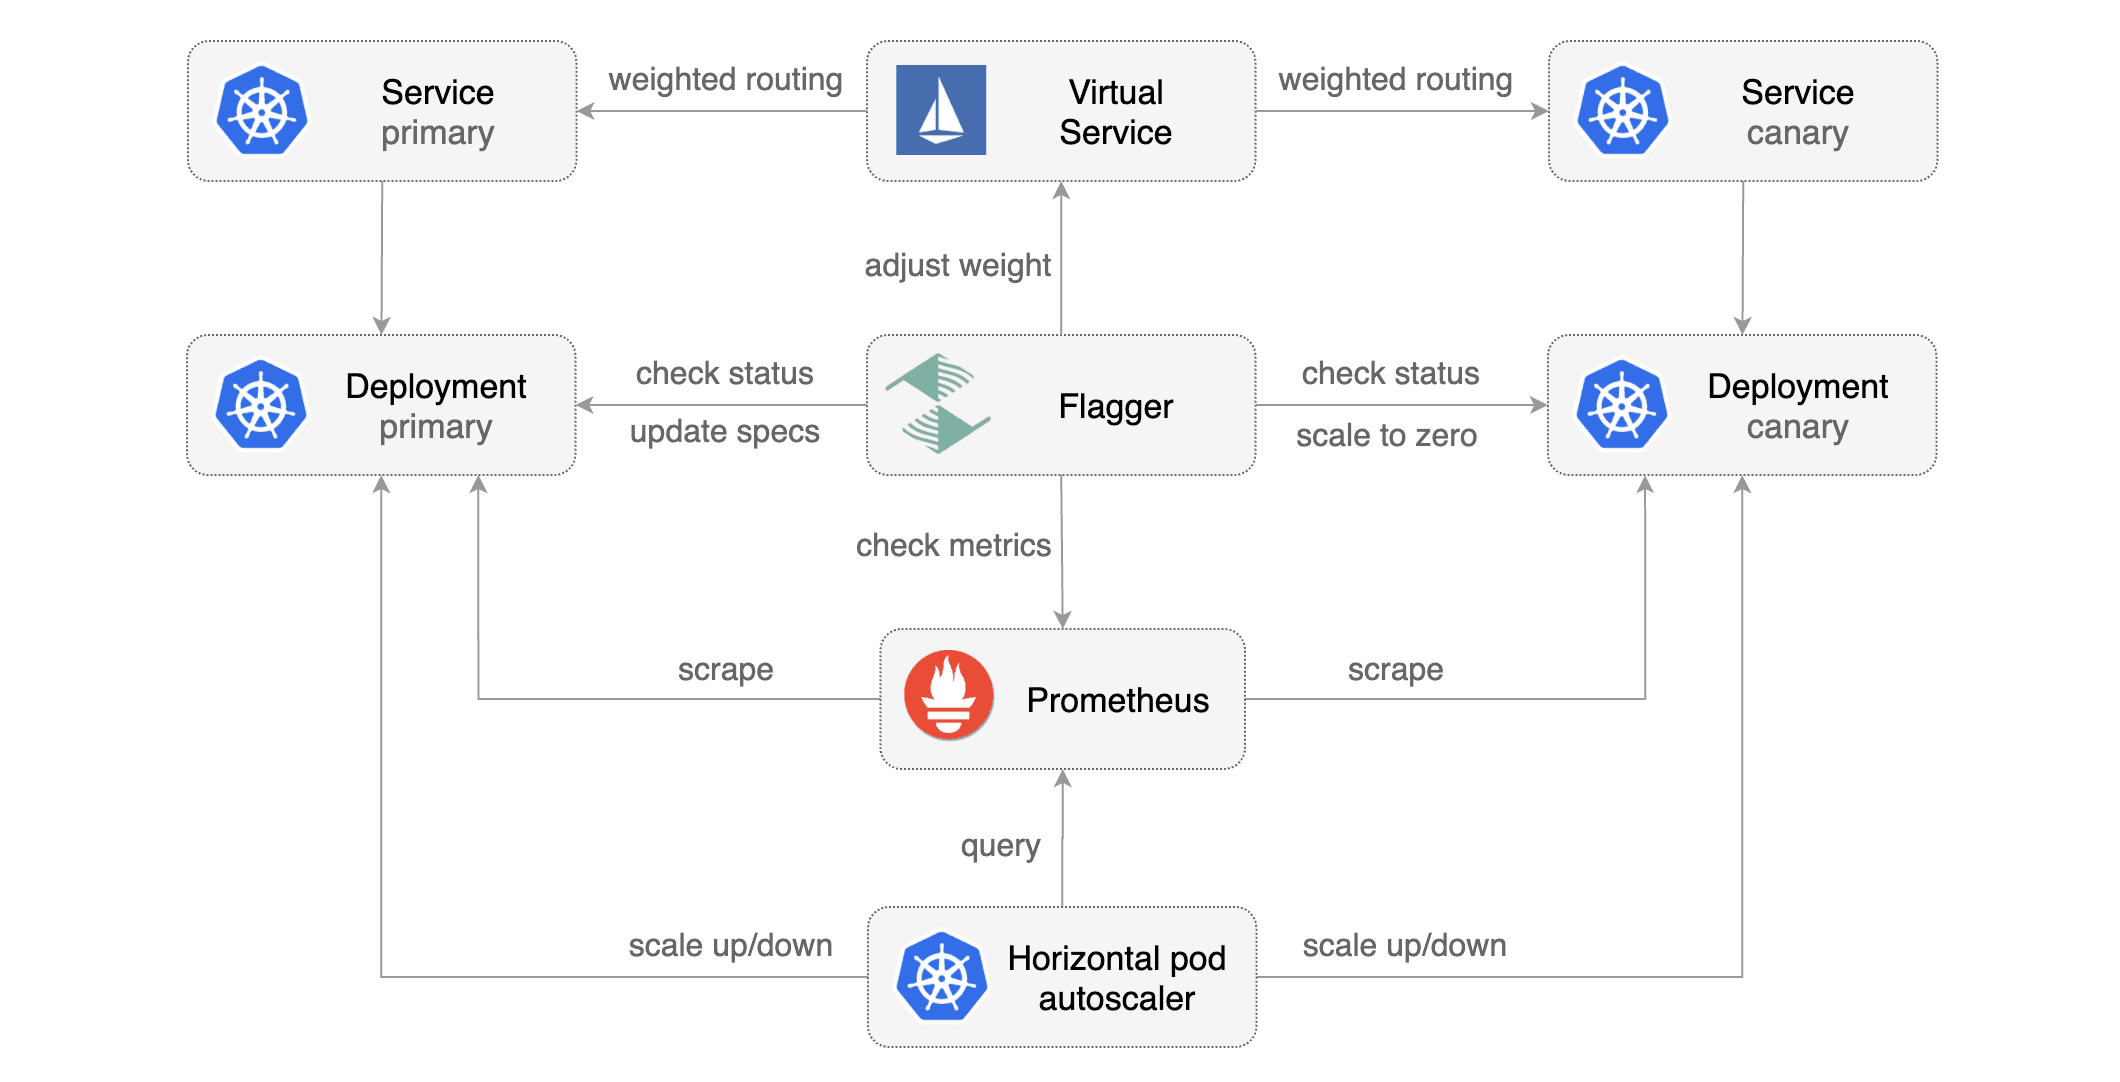
Flagger takes a Kubernetes deployment and creates a series of objects
|
||||
(Kubernetes [deployments](https://kubernetes.io/docs/concepts/workloads/controllers/deployment/),
|
||||
ClusterIP [services](https://kubernetes.io/docs/concepts/services-networking/service/) and
|
||||
Istio [virtual services](https://istio.io/docs/reference/config/istio.networking.v1alpha3/#VirtualService))
|
||||
to drive the canary analysis and promotion.
|
||||
|
||||
|
||||
|
||||
@@ -44,25 +46,25 @@ Gated canary promotion stages:
|
||||
* scan for canary deployments
|
||||
* check Istio virtual service routes are mapped to primary and canary ClusterIP services
|
||||
* check primary and canary deployments status
|
||||
* halt rollout if a rolling update is underway
|
||||
* halt rollout if pods are unhealthy
|
||||
* halt advancement if a rolling update is underway
|
||||
* halt advancement if pods are unhealthy
|
||||
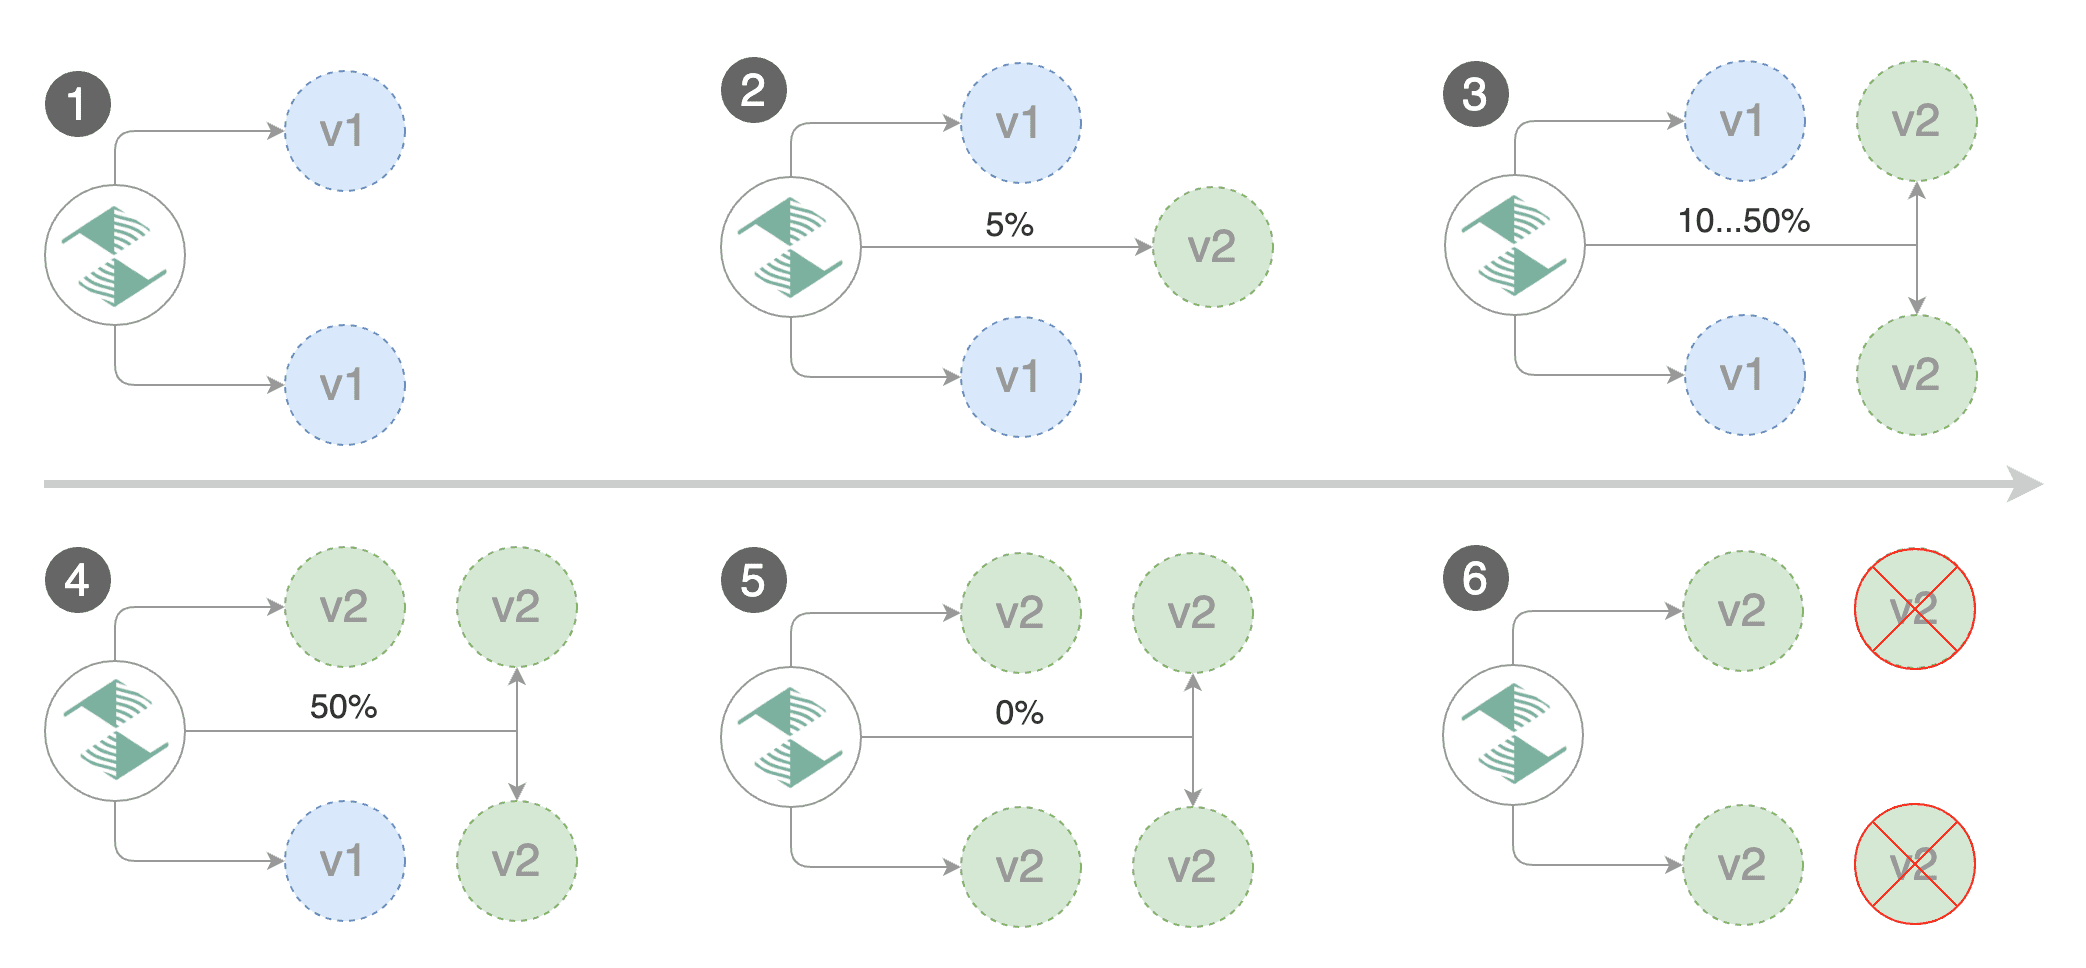
* increase canary traffic weight percentage from 0% to 5% (step weight)
|
||||
* check canary HTTP request success rate and latency
|
||||
* halt rollout if any metric is under the specified threshold
|
||||
* halt advancement if any metric is under the specified threshold
|
||||
* increment the failed checks counter
|
||||
* check if the number of failed checks reached the threshold
|
||||
* route all traffic to primary
|
||||
* scale to zero the canary deployment and mark it as failed
|
||||
* wait for the canary deployment to be updated (revision bump) and start over
|
||||
* increase canary traffic weight by 5% (step weight) till it reaches 50% (max weight)
|
||||
* halt rollout while canary request success rate is under the threshold
|
||||
* halt rollout while canary request duration P99 is over the threshold
|
||||
* halt rollout if the primary or canary deployment becomes unhealthy
|
||||
* halt rollout while canary deployment is being scaled up/down by HPA
|
||||
* halt advancement while canary request success rate is under the threshold
|
||||
* halt advancement while canary request duration P99 is over the threshold
|
||||
* halt advancement if the primary or canary deployment becomes unhealthy
|
||||
* halt advancement while canary deployment is being scaled up/down by HPA
|
||||
* promote canary to primary
|
||||
* copy canary deployment spec template over primary
|
||||
* wait for primary rolling update to finish
|
||||
* halt rollout if pods are unhealthy
|
||||
* halt advancement if pods are unhealthy
|
||||
* route all traffic to primary
|
||||
* scale to zero the canary deployment
|
||||
* mark rollout as finished
|
||||
@@ -70,76 +72,43 @@ Gated canary promotion stages:
|
||||
|
||||
You can change the canary analysis _max weight_ and the _step weight_ percentage in the Flagger's custom resource.
|
||||
|
||||
Assuming the primary deployment is named _podinfo_ and the canary one _podinfo-canary_, Flagger will require
|
||||
a virtual service configured with weight-based routing:
|
||||
For a deployment named _podinfo_, a canary promotion can be defined using Flagger's custom resource:
|
||||
|
||||
```yaml
|
||||
apiVersion: networking.istio.io/v1alpha3
|
||||
kind: VirtualService
|
||||
metadata:
|
||||
name: podinfo
|
||||
spec:
|
||||
hosts:
|
||||
- podinfo
|
||||
http:
|
||||
- route:
|
||||
- destination:
|
||||
host: podinfo
|
||||
port:
|
||||
number: 9898
|
||||
weight: 100
|
||||
- destination:
|
||||
host: podinfo-canary
|
||||
port:
|
||||
number: 9898
|
||||
weight: 0
|
||||
```
|
||||
|
||||
Primary and canary services should expose a port named http:
|
||||
|
||||
```yaml
|
||||
apiVersion: v1
|
||||
kind: Service
|
||||
metadata:
|
||||
name: podinfo-canary
|
||||
spec:
|
||||
type: ClusterIP
|
||||
selector:
|
||||
app: podinfo-canary
|
||||
ports:
|
||||
- name: http
|
||||
port: 9898
|
||||
targetPort: 9898
|
||||
```
|
||||
|
||||
Based on the two deployments, services and virtual service, a canary promotion can be defined using Flagger's custom resource:
|
||||
|
||||
```yaml
|
||||
apiVersion: flagger.app/v1beta1
|
||||
apiVersion: flagger.app/v1alpha1
|
||||
kind: Canary
|
||||
metadata:
|
||||
name: podinfo
|
||||
namespace: test
|
||||
spec:
|
||||
targetKind: Deployment
|
||||
virtualService:
|
||||
# deployment reference
|
||||
targetRef:
|
||||
apiVersion: apps/v1
|
||||
kind: Deployment
|
||||
name: podinfo
|
||||
primary:
|
||||
# hpa reference (optional)
|
||||
autoscalerRef:
|
||||
apiVersion: autoscaling/v2beta1
|
||||
kind: HorizontalPodAutoscaler
|
||||
name: podinfo
|
||||
host: podinfo
|
||||
canary:
|
||||
name: podinfo-canary
|
||||
host: podinfo-canary
|
||||
service:
|
||||
# container port
|
||||
port: 9898
|
||||
# Istio gateways (optional)
|
||||
gateways:
|
||||
- public-gateway.istio-system.svc.cluster.local
|
||||
# Istio virtual service host names (optional)
|
||||
hosts:
|
||||
- app.istio.weavedx.com
|
||||
canaryAnalysis:
|
||||
# max number of failed checks
|
||||
# before rolling back the canary
|
||||
threshold: 10
|
||||
# max number of failed metric checks before rollback
|
||||
threshold: 5
|
||||
# max traffic percentage routed to canary
|
||||
# percentage (0-100)
|
||||
maxWeight: 50
|
||||
# canary increment step
|
||||
# percentage (0-100)
|
||||
stepWeight: 5
|
||||
stepWeight: 10
|
||||
metrics:
|
||||
- name: istio_requests_total
|
||||
# minimum req success rate (non 5xx responses)
|
||||
@@ -150,14 +119,14 @@ spec:
|
||||
# maximum req duration P99
|
||||
# milliseconds
|
||||
threshold: 500
|
||||
interval: 1m
|
||||
interval: 30s
|
||||
```
|
||||
|
||||
The canary analysis is using the following promql queries:
|
||||
|
||||
_HTTP requests success rate percentage_
|
||||
|
||||
```promql
|
||||
```
|
||||
sum(
|
||||
rate(
|
||||
istio_requests_total{
|
||||
@@ -182,7 +151,7 @@ sum(
|
||||
|
||||
_HTTP requests milliseconds duration P99_
|
||||
|
||||
```promql
|
||||
```
|
||||
histogram_quantile(0.99,
|
||||
sum(
|
||||
irate(
|
||||
@@ -198,8 +167,6 @@ histogram_quantile(0.99,
|
||||
|
||||
### Automated canary analysis, promotions and rollbacks
|
||||
|
||||
|
||||
|
||||
Create a test namespace with Istio sidecar injection enabled:
|
||||
|
||||
```bash
|
||||
@@ -208,66 +175,72 @@ export REPO=https://raw.githubusercontent.com/stefanprodan/flagger/master
|
||||
kubectl apply -f ${REPO}/artifacts/namespaces/test.yaml
|
||||
```
|
||||
|
||||
Create the primary deployment, service and hpa:
|
||||
Create a deployment and a horizontal pod autoscaler:
|
||||
|
||||
```bash
|
||||
kubectl apply -f ${REPO}/artifacts/workloads/primary-deployment.yaml
|
||||
kubectl apply -f ${REPO}/artifacts/workloads/primary-service.yaml
|
||||
kubectl apply -f ${REPO}/artifacts/workloads/primary-hpa.yaml
|
||||
kubectl apply -f ${REPO}/artifacts/canaries/deployment.yaml
|
||||
kubectl apply -f ${REPO}/artifacts/canaries/hpa.yaml
|
||||
```
|
||||
|
||||
Create the canary deployment, service and hpa:
|
||||
Create a canary promotion custom resource (replace the Istio gateway and the internet domain with your own):
|
||||
|
||||
```bash
|
||||
kubectl apply -f ${REPO}/artifacts/workloads/canary-deployment.yaml
|
||||
kubectl apply -f ${REPO}/artifacts/workloads/canary-service.yaml
|
||||
kubectl apply -f ${REPO}/artifacts/workloads/canary-hpa.yaml
|
||||
kubectl apply -f ${REPO}/artifacts/canaries/canary.yaml
|
||||
```
|
||||
|
||||
Create a virtual service (replace the Istio gateway and the internet domain with your own):
|
||||
After a couple of seconds Flagger will create the canary objects:
|
||||
|
||||
```bash
|
||||
kubectl apply -f ${REPO}/artifacts/workloads/virtual-service.yaml
|
||||
# applied
|
||||
deployment.apps/podinfo
|
||||
horizontalpodautoscaler.autoscaling/podinfo
|
||||
canary.flagger.app/podinfo
|
||||
# generated
|
||||
deployment.apps/podinfo-primary
|
||||
horizontalpodautoscaler.autoscaling/podinfo-primary
|
||||
service/podinfo
|
||||
service/podinfo-canary
|
||||
service/podinfo-primary
|
||||
virtualservice.networking.istio.io/podinfo
|
||||
```
|
||||
|
||||
Create a canary promotion custom resource:
|
||||
|
||||
|
||||
Trigger a canary deployment by updating the container image:
|
||||
|
||||
```bash
|
||||
kubectl apply -f ${REPO}/artifacts/rollouts/podinfo.yaml
|
||||
kubectl -n test set image deployment/podinfo \
|
||||
podinfod=quay.io/stefanprodan/podinfo:1.2.1
|
||||
```
|
||||
|
||||
Canary promotion output:
|
||||
Flagger detects that the deployment revision changed and starts a new rollout:
|
||||
|
||||
```
|
||||
kubectl -n test describe canary/podinfo
|
||||
|
||||
Status:
|
||||
Canary Revision: 16271121
|
||||
Failed Checks: 6
|
||||
Canary Revision: 19871136
|
||||
Failed Checks: 0
|
||||
State: finished
|
||||
Events:
|
||||
Type Reason Age From Message
|
||||
---- ------ ---- ---- -------
|
||||
Normal Synced 3m flagger Starting canary deployment for podinfo.test
|
||||
Normal Synced 3m flagger New revision detected podinfo.test
|
||||
Normal Synced 3m flagger Scaling up podinfo.test
|
||||
Warning Synced 3m flagger Waiting for podinfo.test rollout to finish: 0 of 1 updated replicas are available
|
||||
Normal Synced 3m flagger Advance podinfo.test canary weight 5
|
||||
Normal Synced 3m flagger Advance podinfo.test canary weight 10
|
||||
Normal Synced 3m flagger Advance podinfo.test canary weight 15
|
||||
Warning Synced 3m flagger Halt podinfo.test advancement request duration 2.525s > 500ms
|
||||
Warning Synced 3m flagger Halt podinfo.test advancement request duration 1.567s > 500ms
|
||||
Warning Synced 3m flagger Halt podinfo.test advancement request duration 823ms > 500ms
|
||||
Normal Synced 2m flagger Advance podinfo.test canary weight 20
|
||||
Normal Synced 2m flagger Advance podinfo.test canary weight 25
|
||||
Normal Synced 1m flagger Advance podinfo.test canary weight 30
|
||||
Warning Synced 1m flagger Halt podinfo.test advancement success rate 82.33% < 99%
|
||||
Warning Synced 1m flagger Halt podinfo.test advancement success rate 87.22% < 99%
|
||||
Warning Synced 1m flagger Halt podinfo.test advancement success rate 94.74% < 99%
|
||||
Normal Synced 1m flagger Advance podinfo.test canary weight 35
|
||||
Normal Synced 55s flagger Advance podinfo.test canary weight 40
|
||||
Normal Synced 45s flagger Advance podinfo.test canary weight 45
|
||||
Normal Synced 35s flagger Advance podinfo.test canary weight 50
|
||||
Normal Synced 25s flagger Copying podinfo-canary.test template spec to podinfo.test
|
||||
Warning Synced 15s flagger Waiting for podinfo.test rollout to finish: 1 of 2 updated replicas are available
|
||||
Normal Synced 5s flagger Promotion completed! Scaling down podinfo-canary.test
|
||||
Normal Synced 25s flagger Copying podinfo.test template spec to podinfo-primary.test
|
||||
Warning Synced 15s flagger Waiting for podinfo-primary.test rollout to finish: 1 of 2 updated replicas are available
|
||||
Normal Synced 5s flagger Promotion completed! Scaling down podinfo.test
|
||||
```
|
||||
|
||||
During the canary analysis you can generate HTTP 500 errors and high latency to test if Flagger pauses the rollout.
|
||||
@@ -313,45 +286,8 @@ Events:
|
||||
Normal Synced 2m flagger Halt podinfo.test advancement success rate 55.06% < 99%
|
||||
Normal Synced 2m flagger Halt podinfo.test advancement success rate 47.00% < 99%
|
||||
Normal Synced 2m flagger (combined from similar events): Halt podinfo.test advancement success rate 38.08% < 99%
|
||||
Warning Synced 1m flagger Rolling back podinfo-canary.test failed checks threshold reached 10
|
||||
Warning Synced 1m flagger Canary failed! Scaling down podinfo-canary.test
|
||||
```
|
||||
|
||||
Trigger a new canary deployment by updating the canary image:
|
||||
|
||||
```bash
|
||||
kubectl -n test set image deployment/podinfo-canary \
|
||||
podinfod=quay.io/stefanprodan/podinfo:1.2.1
|
||||
```
|
||||
|
||||
Steer detects that the canary revision changed and starts a new rollout:
|
||||
|
||||
```
|
||||
kubectl -n test describe canary/podinfo
|
||||
|
||||
Status:
|
||||
Canary Revision: 19871136
|
||||
Failed Checks: 0
|
||||
State: finished
|
||||
Events:
|
||||
Type Reason Age From Message
|
||||
---- ------ ---- ---- -------
|
||||
Normal Synced 3m flagger New revision detected podinfo-canary.test old 17211012 new 17246876
|
||||
Normal Synced 3m flagger Scaling up podinfo.test
|
||||
Warning Synced 3m flagger Waiting for podinfo.test rollout to finish: 0 of 1 updated replicas are available
|
||||
Normal Synced 3m flagger Advance podinfo.test canary weight 5
|
||||
Normal Synced 3m flagger Advance podinfo.test canary weight 10
|
||||
Normal Synced 3m flagger Advance podinfo.test canary weight 15
|
||||
Normal Synced 2m flagger Advance podinfo.test canary weight 20
|
||||
Normal Synced 2m flagger Advance podinfo.test canary weight 25
|
||||
Normal Synced 1m flagger Advance podinfo.test canary weight 30
|
||||
Normal Synced 1m flagger Advance podinfo.test canary weight 35
|
||||
Normal Synced 55s flagger Advance podinfo.test canary weight 40
|
||||
Normal Synced 45s flagger Advance podinfo.test canary weight 45
|
||||
Normal Synced 35s flagger Advance podinfo.test canary weight 50
|
||||
Normal Synced 25s flagger Copying podinfo-canary.test template spec to podinfo.test
|
||||
Warning Synced 15s flagger Waiting for podinfo.test rollout to finish: 1 of 2 updated replicas are available
|
||||
Normal Synced 5s flagger Promotion completed! Scaling down podinfo-canary.test
|
||||
Warning Synced 1m flagger Rolling back podinfo.test failed checks threshold reached 10
|
||||
Warning Synced 1m flagger Canary failed! Scaling down podinfo.test
|
||||
```
|
||||
|
||||
### Monitoring
|
||||
@@ -388,9 +324,31 @@ Advance podinfo.test canary weight 40
|
||||
Halt podinfo.test advancement request duration 1.515s > 500ms
|
||||
Advance podinfo.test canary weight 45
|
||||
Advance podinfo.test canary weight 50
|
||||
Copying podinfo-canary.test template spec to podinfo-primary.test
|
||||
Scaling down podinfo-canary.test
|
||||
Promotion completed! podinfo-canary.test revision 81289
|
||||
Copying podinfo.test template spec to podinfo-primary.test
|
||||
Halt podinfo-primary.test advancement waiting for rollout to finish: 1 old replicas are pending termination
|
||||
Scaling down podinfo.test
|
||||
Promotion completed! podinfo.test
|
||||
```
|
||||
|
||||
Flagger exposes Prometheus metrics that can be used to determine the canary analysis status and the destination weight values:
|
||||
|
||||
```bash
|
||||
# Canaries total gauge
|
||||
flagger_canary_total{namespace="test"} 1
|
||||
|
||||
# Canary promotion last known status gauge
|
||||
# 0 - running, 1 - successful, 2 - failed
|
||||
flagger_canary_status{name="podinfo" namespace="test"} 1
|
||||
|
||||
# Canary traffic weight gauge
|
||||
flagger_canary_weight{workload="podinfo-primary" namespace="test"} 95
|
||||
flagger_canary_weight{workload="podinfo" namespace="test"} 5
|
||||
|
||||
# Seconds spent performing canary analysis histogram
|
||||
flagger_canary_duration_seconds_bucket{name="podinfo",namespace="test",le="10"} 6
|
||||
flagger_canary_duration_seconds_bucket{name="podinfo",namespace="test",le="+Inf"} 6
|
||||
flagger_canary_duration_seconds_sum{name="podinfo",namespace="test"} 17.3561329
|
||||
flagger_canary_duration_seconds_count{name="podinfo",namespace="test"} 6
|
||||
```
|
||||
|
||||
### Roadmap
|
||||
@@ -398,7 +356,7 @@ Promotion completed! podinfo-canary.test revision 81289
|
||||
* Extend the canary analysis and promotion to other types than Kubernetes deployments such as Flux Helm releases or OpenFaaS functions
|
||||
* Extend the validation mechanism to support other metrics than HTTP success rate and latency
|
||||
* Add support for comparing the canary metrics to the primary ones and do the validation based on the derivation between the two
|
||||
* Alerting: Trigger Alertmanager on successful or failed promotions (Prometheus instrumentation of the canary analysis)
|
||||
* Alerting: trigger Alertmanager on successful or failed promotions
|
||||
* Reporting: publish canary analysis results to Slack/Jira/etc
|
||||
|
||||
### Contributing
|
||||
|
||||
Binary file not shown.
Binary file not shown.
@@ -2,12 +2,12 @@ apiVersion: v1
|
||||
entries:
|
||||
flagger:
|
||||
- apiVersion: v1
|
||||
appVersion: 0.1.0-beta.2
|
||||
created: 2018-10-23T13:41:32.286045+03:00
|
||||
appVersion: 0.1.0-beta.6
|
||||
created: 2018-10-29T21:46:00.29473+02:00
|
||||
description: Flagger is a Kubernetes operator that automates the promotion of
|
||||
canary deployments using Istio routing for traffic shifting and Prometheus metrics
|
||||
for canary analysis.
|
||||
digest: 6a4b286f58712d955a2ca4c8b35a113a61c344dfbdb5e3f2b26240f31284775f
|
||||
digest: c17380b0f4e08a9b1f76a0e52d53677248c5756eff6a1fcd5629d3465dd1ad58
|
||||
home: https://github.com/stefanprodan/flagger
|
||||
name: flagger
|
||||
urls:
|
||||
@@ -16,13 +16,13 @@ entries:
|
||||
grafana:
|
||||
- apiVersion: v1
|
||||
appVersion: 5.3.1
|
||||
created: 2018-10-23T13:41:32.286714+03:00
|
||||
created: 2018-10-29T21:46:00.295247+02:00
|
||||
description: A Grafana Helm chart for monitoring progressive deployments powered
|
||||
by Istio and Flagger
|
||||
digest: 18f53f2aa513730a9cd4c018d369aed3481ff884a4d8000223cef3ad584ebaec
|
||||
digest: 370aa2e6a0d4ab717f047658bdb02969b8f2a4d2e81c0bc96b90e3365229715f
|
||||
home: https://github.com/stefanprodan/flagger
|
||||
name: grafana
|
||||
urls:
|
||||
- https://stefanprodan.github.io/flagger/grafana-0.1.0.tgz
|
||||
version: 0.1.0
|
||||
generated: 2018-10-23T13:41:32.285612+03:00
|
||||
generated: 2018-10-29T21:46:00.293821+02:00
|
||||
|
||||
@@ -67,12 +67,15 @@ type CanaryStatus struct {
|
||||
FailedChecks int `json:"failedChecks"`
|
||||
}
|
||||
|
||||
// CanaryService is used to create ClusterIP services
|
||||
// and Istio Virtual Service
|
||||
type CanaryService struct {
|
||||
Port int32 `json:"port"`
|
||||
Gateways []string `json:"gateways"`
|
||||
Hosts []string `json:"hosts"`
|
||||
}
|
||||
|
||||
// CanaryAnalysis is used to describe how the analysis should be done
|
||||
type CanaryAnalysis struct {
|
||||
Threshold int `json:"threshold"`
|
||||
MaxWeight int `json:"maxWeight"`
|
||||
@@ -80,6 +83,7 @@ type CanaryAnalysis struct {
|
||||
Metrics []CanaryMetric `json:"metrics"`
|
||||
}
|
||||
|
||||
// CanaryMetric hold the reference to Istio metrics used for canary analysis
|
||||
type CanaryMetric struct {
|
||||
Name string `json:"name"`
|
||||
Interval string `json:"interval"`
|
||||
|
||||
@@ -27,6 +27,7 @@ import (
|
||||
|
||||
const controllerAgentName = "flagger"
|
||||
|
||||
// Controller is managing the canary objects and schedules canary deployments
|
||||
type Controller struct {
|
||||
kubeClient kubernetes.Interface
|
||||
istioClient istioclientset.Interface
|
||||
@@ -35,12 +36,13 @@ type Controller struct {
|
||||
flaggerSynced cache.InformerSynced
|
||||
flaggerWindow time.Duration
|
||||
workqueue workqueue.RateLimitingInterface
|
||||
recorder record.EventRecorder
|
||||
eventRecorder record.EventRecorder
|
||||
logger *zap.SugaredLogger
|
||||
canaries *sync.Map
|
||||
deployer CanaryDeployer
|
||||
router CanaryRouter
|
||||
observer CanaryObserver
|
||||
recorder CanaryRecorder
|
||||
}
|
||||
|
||||
func NewController(
|
||||
@@ -60,7 +62,7 @@ func NewController(
|
||||
eventBroadcaster.StartRecordingToSink(&typedcorev1.EventSinkImpl{
|
||||
Interface: kubeClient.CoreV1().Events(""),
|
||||
})
|
||||
recorder := eventBroadcaster.NewRecorder(
|
||||
eventRecorder := eventBroadcaster.NewRecorder(
|
||||
scheme.Scheme, corev1.EventSource{Component: controllerAgentName})
|
||||
|
||||
deployer := CanaryDeployer{
|
||||
@@ -81,6 +83,8 @@ func NewController(
|
||||
metricsServer: metricServer,
|
||||
}
|
||||
|
||||
recorder := NewCanaryRecorder(true)
|
||||
|
||||
ctrl := &Controller{
|
||||
kubeClient: kubeClient,
|
||||
istioClient: istioClient,
|
||||
@@ -88,13 +92,14 @@ func NewController(
|
||||
flaggerLister: flaggerInformer.Lister(),
|
||||
flaggerSynced: flaggerInformer.Informer().HasSynced,
|
||||
workqueue: workqueue.NewNamedRateLimitingQueue(workqueue.DefaultControllerRateLimiter(), controllerAgentName),
|
||||
recorder: recorder,
|
||||
eventRecorder: eventRecorder,
|
||||
logger: logger,
|
||||
canaries: new(sync.Map),
|
||||
flaggerWindow: flaggerWindow,
|
||||
deployer: deployer,
|
||||
router: router,
|
||||
observer: observer,
|
||||
recorder: recorder,
|
||||
}
|
||||
|
||||
flaggerInformer.Informer().AddEventHandler(cache.ResourceEventHandlerFuncs{
|
||||
@@ -126,6 +131,7 @@ func NewController(
|
||||
return ctrl
|
||||
}
|
||||
|
||||
// Run starts the K8s workers and the canary scheduler
|
||||
func (c *Controller) Run(threadiness int, stopCh <-chan struct{}) error {
|
||||
defer utilruntime.HandleCrash()
|
||||
defer c.workqueue.ShutDown()
|
||||
@@ -151,8 +157,6 @@ func (c *Controller) Run(threadiness int, stopCh <-chan struct{}) error {
|
||||
return nil
|
||||
}
|
||||
}
|
||||
|
||||
return nil
|
||||
}
|
||||
|
||||
func (c *Controller) processNextWorkItem() bool {
|
||||
@@ -239,17 +243,17 @@ func checkCustomResourceType(obj interface{}, logger *zap.SugaredLogger) (flagge
|
||||
|
||||
func (c *Controller) recordEventInfof(r *flaggerv1.Canary, template string, args ...interface{}) {
|
||||
c.logger.Infof(template, args...)
|
||||
c.recorder.Event(r, corev1.EventTypeNormal, "Synced", fmt.Sprintf(template, args...))
|
||||
c.eventRecorder.Event(r, corev1.EventTypeNormal, "Synced", fmt.Sprintf(template, args...))
|
||||
}
|
||||
|
||||
func (c *Controller) recordEventErrorf(r *flaggerv1.Canary, template string, args ...interface{}) {
|
||||
c.logger.Errorf(template, args...)
|
||||
c.recorder.Event(r, corev1.EventTypeWarning, "Synced", fmt.Sprintf(template, args...))
|
||||
c.eventRecorder.Event(r, corev1.EventTypeWarning, "Synced", fmt.Sprintf(template, args...))
|
||||
}
|
||||
|
||||
func (c *Controller) recordEventWarningf(r *flaggerv1.Canary, template string, args ...interface{}) {
|
||||
c.logger.Infof(template, args...)
|
||||
c.recorder.Event(r, corev1.EventTypeWarning, "Synced", fmt.Sprintf(template, args...))
|
||||
c.eventRecorder.Event(r, corev1.EventTypeWarning, "Synced", fmt.Sprintf(template, args...))
|
||||
}
|
||||
|
||||
func int32p(i int32) *int32 {
|
||||
|
||||
@@ -21,6 +21,7 @@ import (
|
||||
"k8s.io/client-go/kubernetes"
|
||||
)
|
||||
|
||||
// CanaryDeployer is managing the operations for Kubernetes deployment kind
|
||||
type CanaryDeployer struct {
|
||||
kubeClient kubernetes.Interface
|
||||
istioClient istioclientset.Interface
|
||||
@@ -123,7 +124,7 @@ func (c *CanaryDeployer) IsNewSpec(cd *flaggerv1.Canary) (bool, error) {
|
||||
return false, nil
|
||||
}
|
||||
|
||||
// SyncStatus updates the canary status state
|
||||
// SetFailedChecks updates the canary failed checks counter
|
||||
func (c *CanaryDeployer) SetFailedChecks(cd *flaggerv1.Canary, val int) error {
|
||||
cd.Status.FailedChecks = val
|
||||
cd, err := c.flaggerClient.FlaggerV1alpha1().Canaries(cd.Namespace).Update(cd)
|
||||
@@ -133,7 +134,7 @@ func (c *CanaryDeployer) SetFailedChecks(cd *flaggerv1.Canary, val int) error {
|
||||
return nil
|
||||
}
|
||||
|
||||
// SyncStatus updates the canary status state
|
||||
// SetState updates the canary status state
|
||||
func (c *CanaryDeployer) SetState(cd *flaggerv1.Canary, state string) error {
|
||||
cd.Status.State = state
|
||||
cd, err := c.flaggerClient.FlaggerV1alpha1().Canaries(cd.Namespace).Update(cd)
|
||||
@@ -217,9 +218,8 @@ func (c *CanaryDeployer) createPrimaryDeployment(cd *flaggerv1.Canary) error {
|
||||
if err != nil {
|
||||
if errors.IsNotFound(err) {
|
||||
return fmt.Errorf("deployment %s.%s not found, retrying", canaryName, cd.Namespace)
|
||||
} else {
|
||||
return err
|
||||
}
|
||||
return err
|
||||
}
|
||||
|
||||
primaryDep, err := c.kubeClient.AppsV1().Deployments(cd.Namespace).Get(primaryName, metav1.GetOptions{})
|
||||
@@ -273,9 +273,8 @@ func (c *CanaryDeployer) createPrimaryHpa(cd *flaggerv1.Canary) error {
|
||||
if errors.IsNotFound(err) {
|
||||
return fmt.Errorf("HorizontalPodAutoscaler %s.%s not found, retrying",
|
||||
cd.Spec.AutoscalerRef.Name, cd.Namespace)
|
||||
} else {
|
||||
return err
|
||||
}
|
||||
return err
|
||||
}
|
||||
primaryHpaName := fmt.Sprintf("%s-primary", cd.Spec.AutoscalerRef.Name)
|
||||
primaryHpa, err := c.kubeClient.AutoscalingV2beta1().HorizontalPodAutoscalers(cd.Namespace).Get(primaryHpaName, metav1.GetOptions{})
|
||||
|
||||
@@ -11,11 +11,12 @@ import (
|
||||
"time"
|
||||
)
|
||||
|
||||
// CanaryObserver is used to query the Istio Prometheus db
|
||||
type CanaryObserver struct {
|
||||
metricsServer string
|
||||
}
|
||||
|
||||
type VectorQueryResponse struct {
|
||||
type vectorQueryResponse struct {
|
||||
Data struct {
|
||||
Result []struct {
|
||||
Metric struct {
|
||||
@@ -27,7 +28,7 @@ type VectorQueryResponse struct {
|
||||
}
|
||||
}
|
||||
|
||||
func (c *CanaryObserver) queryMetric(query string) (*VectorQueryResponse, error) {
|
||||
func (c *CanaryObserver) queryMetric(query string) (*vectorQueryResponse, error) {
|
||||
promURL, err := url.Parse(c.metricsServer)
|
||||
if err != nil {
|
||||
return nil, err
|
||||
@@ -63,7 +64,7 @@ func (c *CanaryObserver) queryMetric(query string) (*VectorQueryResponse, error)
|
||||
return nil, fmt.Errorf("error response: %s", string(b))
|
||||
}
|
||||
|
||||
var values VectorQueryResponse
|
||||
var values vectorQueryResponse
|
||||
err = json.Unmarshal(b, &values)
|
||||
if err != nil {
|
||||
return nil, fmt.Errorf("error unmarshaling result: %s, '%s'", err.Error(), string(b))
|
||||
@@ -72,7 +73,7 @@ func (c *CanaryObserver) queryMetric(query string) (*VectorQueryResponse, error)
|
||||
return &values, nil
|
||||
}
|
||||
|
||||
// istio_requests_total
|
||||
// GetDeploymentCounter returns the requests success rate using istio_requests_total metric
|
||||
func (c *CanaryObserver) GetDeploymentCounter(name string, namespace string, metric string, interval string) (float64, error) {
|
||||
if c.metricsServer == "fake" {
|
||||
return 100, nil
|
||||
@@ -109,7 +110,7 @@ func (c *CanaryObserver) GetDeploymentCounter(name string, namespace string, met
|
||||
return *rate, nil
|
||||
}
|
||||
|
||||
// istio_request_duration_seconds_bucket
|
||||
// GetDeploymentHistogram returns the 99P requests delay using istio_request_duration_seconds_bucket metrics
|
||||
func (c *CanaryObserver) GetDeploymentHistogram(name string, namespace string, metric string, interval string) (time.Duration, error) {
|
||||
if c.metricsServer == "fake" {
|
||||
return 1, nil
|
||||
@@ -143,6 +144,8 @@ func (c *CanaryObserver) GetDeploymentHistogram(name string, namespace string, m
|
||||
return ms, nil
|
||||
}
|
||||
|
||||
// CheckMetricsServer call Prometheus status endpoint and returns an error if
|
||||
// the API is unreachable
|
||||
func CheckMetricsServer(address string) (bool, error) {
|
||||
promURL, err := url.Parse(address)
|
||||
if err != nil {
|
||||
|
||||
90
pkg/controller/recorder.go
Normal file
90
pkg/controller/recorder.go
Normal file
@@ -0,0 +1,90 @@
|
||||
package controller
|
||||
|
||||
import (
|
||||
"fmt"
|
||||
"time"
|
||||
|
||||
"github.com/prometheus/client_golang/prometheus"
|
||||
flaggerv1 "github.com/stefanprodan/flagger/pkg/apis/flagger/v1alpha1"
|
||||
)
|
||||
|
||||
// CanaryRecorder records the canary analysis as Prometheus metrics
|
||||
type CanaryRecorder struct {
|
||||
duration *prometheus.HistogramVec
|
||||
total *prometheus.GaugeVec
|
||||
status *prometheus.GaugeVec
|
||||
weight *prometheus.GaugeVec
|
||||
}
|
||||
|
||||
// NewCanaryRecorder creates a new recorder and registers the Prometheus metrics
|
||||
func NewCanaryRecorder(register bool) CanaryRecorder {
|
||||
duration := prometheus.NewHistogramVec(prometheus.HistogramOpts{
|
||||
Subsystem: controllerAgentName,
|
||||
Name: "canary_duration_seconds",
|
||||
Help: "Seconds spent performing canary analysis.",
|
||||
Buckets: prometheus.DefBuckets,
|
||||
}, []string{"name", "namespace"})
|
||||
|
||||
total := prometheus.NewGaugeVec(prometheus.GaugeOpts{
|
||||
Subsystem: controllerAgentName,
|
||||
Name: "canary_total",
|
||||
Help: "Total number of canary object",
|
||||
}, []string{"namespace"})
|
||||
|
||||
// 0 - running, 1 - successful, 2 - failed
|
||||
status := prometheus.NewGaugeVec(prometheus.GaugeOpts{
|
||||
Subsystem: controllerAgentName,
|
||||
Name: "canary_status",
|
||||
Help: "Last canary analysis result",
|
||||
}, []string{"name", "namespace"})
|
||||
|
||||
weight := prometheus.NewGaugeVec(prometheus.GaugeOpts{
|
||||
Subsystem: controllerAgentName,
|
||||
Name: "canary_weight",
|
||||
Help: "The virtual service destination weight current value",
|
||||
}, []string{"workload", "namespace"})
|
||||
|
||||
if register {
|
||||
prometheus.MustRegister(duration)
|
||||
prometheus.MustRegister(total)
|
||||
prometheus.MustRegister(status)
|
||||
prometheus.MustRegister(weight)
|
||||
}
|
||||
|
||||
return CanaryRecorder{
|
||||
duration: duration,
|
||||
total: total,
|
||||
status: status,
|
||||
weight: weight,
|
||||
}
|
||||
}
|
||||
|
||||
// SetDuration sets the time spent in seconds performing canary analysis
|
||||
func (cr *CanaryRecorder) SetDuration(cd *flaggerv1.Canary, duration time.Duration) {
|
||||
cr.duration.WithLabelValues(cd.Spec.TargetRef.Name, cd.Namespace).Observe(duration.Seconds())
|
||||
}
|
||||
|
||||
// SetTotal sets the total number of canaries per namespace
|
||||
func (cr *CanaryRecorder) SetTotal(namespace string, total int) {
|
||||
cr.total.WithLabelValues(namespace).Set(float64(total))
|
||||
}
|
||||
|
||||
// SetStatus sets the last known canary analysis status
|
||||
func (cr *CanaryRecorder) SetStatus(cd *flaggerv1.Canary) {
|
||||
status := 1
|
||||
switch cd.Status.State {
|
||||
case "running":
|
||||
status = 0
|
||||
case "failed":
|
||||
status = 2
|
||||
default:
|
||||
status = 1
|
||||
}
|
||||
cr.status.WithLabelValues(cd.Spec.TargetRef.Name, cd.Namespace).Set(float64(status))
|
||||
}
|
||||
|
||||
// SetWeight sets the weight values for primary and canary destinations
|
||||
func (cr *CanaryRecorder) SetWeight(cd *flaggerv1.Canary, primary int, canary int) {
|
||||
cr.weight.WithLabelValues(fmt.Sprintf("%s-primary", cd.Spec.TargetRef.Name), cd.Namespace).Set(float64(primary))
|
||||
cr.weight.WithLabelValues(cd.Spec.TargetRef.Name, cd.Namespace).Set(float64(canary))
|
||||
}
|
||||
@@ -17,6 +17,8 @@ import (
|
||||
"k8s.io/client-go/kubernetes"
|
||||
)
|
||||
|
||||
// CanaryRouter is managing the operations for Kubernetes service kind
|
||||
// and Istio virtual services
|
||||
type CanaryRouter struct {
|
||||
kubeClient kubernetes.Interface
|
||||
istioClient istioclientset.Interface
|
||||
|
||||
@@ -9,16 +9,28 @@ import (
|
||||
)
|
||||
|
||||
func (c *Controller) scheduleCanaries() {
|
||||
stats := make(map[string]int)
|
||||
c.canaries.Range(func(key interface{}, value interface{}) bool {
|
||||
r := value.(*flaggerv1.Canary)
|
||||
if r.Spec.TargetRef.Kind == "Deployment" {
|
||||
go c.advanceCanary(r.Name, r.Namespace)
|
||||
}
|
||||
|
||||
t, ok := stats[r.Namespace]
|
||||
if !ok {
|
||||
stats[r.Namespace] = 1
|
||||
} else {
|
||||
stats[r.Namespace] = t + 1
|
||||
}
|
||||
return true
|
||||
})
|
||||
for k, v := range stats {
|
||||
c.recorder.SetTotal(k, v)
|
||||
}
|
||||
}
|
||||
|
||||
func (c *Controller) advanceCanary(name string, namespace string) {
|
||||
begin := time.Now()
|
||||
// check if the canary exists
|
||||
cd, err := c.flaggerClient.FlaggerV1alpha1().Canaries(namespace).Get(name, v1.GetOptions{})
|
||||
if err != nil {
|
||||
@@ -58,11 +70,17 @@ func (c *Controller) advanceCanary(name string, namespace string) {
|
||||
return
|
||||
}
|
||||
|
||||
c.recorder.SetWeight(cd, primaryRoute.Weight, canaryRoute.Weight)
|
||||
|
||||
// check if canary analysis should start (canary revision has changes) or continue
|
||||
if ok := c.checkCanaryStatus(cd, c.deployer); !ok {
|
||||
return
|
||||
}
|
||||
|
||||
defer func() {
|
||||
c.recorder.SetDuration(cd, time.Since(begin))
|
||||
}()
|
||||
|
||||
// check if the number of failed checks reached the threshold
|
||||
if cd.Status.State == "running" && cd.Status.FailedChecks >= cd.Spec.CanaryAnalysis.Threshold {
|
||||
c.recordEventWarningf(cd, "Rolling back %s.%s failed checks threshold reached %v",
|
||||
@@ -76,6 +94,7 @@ func (c *Controller) advanceCanary(name string, namespace string) {
|
||||
return
|
||||
}
|
||||
|
||||
c.recorder.SetWeight(cd, primaryRoute.Weight, canaryRoute.Weight)
|
||||
c.recordEventWarningf(cd, "Canary failed! Scaling down %s.%s",
|
||||
cd.Spec.TargetRef.Name, cd.Namespace)
|
||||
|
||||
@@ -90,6 +109,7 @@ func (c *Controller) advanceCanary(name string, namespace string) {
|
||||
c.logger.Errorf("%v", err)
|
||||
return
|
||||
}
|
||||
c.recorder.SetStatus(cd)
|
||||
return
|
||||
}
|
||||
|
||||
@@ -123,6 +143,7 @@ func (c *Controller) advanceCanary(name string, namespace string) {
|
||||
return
|
||||
}
|
||||
|
||||
c.recorder.SetWeight(cd, primaryRoute.Weight, canaryRoute.Weight)
|
||||
c.recordEventInfof(cd, "Advance %s.%s canary weight %v", cd.Name, cd.Namespace, canaryRoute.Weight)
|
||||
|
||||
// promote canary
|
||||
@@ -144,6 +165,7 @@ func (c *Controller) advanceCanary(name string, namespace string) {
|
||||
return
|
||||
}
|
||||
|
||||
c.recorder.SetWeight(cd, primaryRoute.Weight, canaryRoute.Weight)
|
||||
c.recordEventInfof(cd, "Promotion completed! Scaling down %s.%s", cd.Spec.TargetRef.Name, cd.Namespace)
|
||||
|
||||
// shutdown canary
|
||||
@@ -157,33 +179,37 @@ func (c *Controller) advanceCanary(name string, namespace string) {
|
||||
c.recordEventWarningf(cd, "%v", err)
|
||||
return
|
||||
}
|
||||
c.recorder.SetStatus(cd)
|
||||
}
|
||||
}
|
||||
|
||||
func (c *Controller) checkCanaryStatus(r *flaggerv1.Canary, deployer CanaryDeployer) bool {
|
||||
if r.Status.State == "running" {
|
||||
func (c *Controller) checkCanaryStatus(cd *flaggerv1.Canary, deployer CanaryDeployer) bool {
|
||||
c.recorder.SetStatus(cd)
|
||||
if cd.Status.State == "running" {
|
||||
return true
|
||||
}
|
||||
|
||||
if r.Status.State == "" {
|
||||
if err := deployer.SyncStatus(r, flaggerv1.CanaryStatus{State: "initialized"}); err != nil {
|
||||
if cd.Status.State == "" {
|
||||
if err := deployer.SyncStatus(cd, flaggerv1.CanaryStatus{State: "initialized"}); err != nil {
|
||||
c.logger.Errorf("%v", err)
|
||||
return false
|
||||
}
|
||||
c.recordEventInfof(r, "Initialization done! %s.%s", r.Name, r.Namespace)
|
||||
c.recorder.SetStatus(cd)
|
||||
c.recordEventInfof(cd, "Initialization done! %s.%s", cd.Name, cd.Namespace)
|
||||
return false
|
||||
}
|
||||
|
||||
if diff, err := deployer.IsNewSpec(r); diff {
|
||||
c.recordEventInfof(r, "New revision detected! Scaling up %s.%s", r.Spec.TargetRef.Name, r.Namespace)
|
||||
if err = deployer.Scale(r, 1); err != nil {
|
||||
c.recordEventErrorf(r, "%v", err)
|
||||
if diff, err := deployer.IsNewSpec(cd); diff {
|
||||
c.recordEventInfof(cd, "New revision detected! Scaling up %s.%s", cd.Spec.TargetRef.Name, cd.Namespace)
|
||||
if err = deployer.Scale(cd, 1); err != nil {
|
||||
c.recordEventErrorf(cd, "%v", err)
|
||||
return false
|
||||
}
|
||||
if err := deployer.SyncStatus(r, flaggerv1.CanaryStatus{State: "running"}); err != nil {
|
||||
if err := deployer.SyncStatus(cd, flaggerv1.CanaryStatus{State: "running"}); err != nil {
|
||||
c.logger.Errorf("%v", err)
|
||||
return false
|
||||
}
|
||||
c.recorder.SetStatus(cd)
|
||||
return false
|
||||
}
|
||||
return false
|
||||
|
||||
@@ -55,13 +55,14 @@ func TestScheduler_Init(t *testing.T) {
|
||||
flaggerLister: flaggerInformer.Lister(),
|
||||
flaggerSynced: flaggerInformer.Informer().HasSynced,
|
||||
workqueue: workqueue.NewNamedRateLimitingQueue(workqueue.DefaultControllerRateLimiter(), controllerAgentName),
|
||||
recorder: &record.FakeRecorder{},
|
||||
eventRecorder: &record.FakeRecorder{},
|
||||
logger: logger,
|
||||
canaries: new(sync.Map),
|
||||
flaggerWindow: time.Second,
|
||||
deployer: deployer,
|
||||
router: router,
|
||||
observer: observer,
|
||||
recorder: NewCanaryRecorder(false),
|
||||
}
|
||||
ctrl.flaggerSynced = alwaysReady
|
||||
|
||||
@@ -108,13 +109,14 @@ func TestScheduler_NewRevision(t *testing.T) {
|
||||
flaggerLister: flaggerInformer.Lister(),
|
||||
flaggerSynced: flaggerInformer.Informer().HasSynced,
|
||||
workqueue: workqueue.NewNamedRateLimitingQueue(workqueue.DefaultControllerRateLimiter(), controllerAgentName),
|
||||
recorder: &record.FakeRecorder{},
|
||||
eventRecorder: &record.FakeRecorder{},
|
||||
logger: logger,
|
||||
canaries: new(sync.Map),
|
||||
flaggerWindow: time.Second,
|
||||
deployer: deployer,
|
||||
router: router,
|
||||
observer: observer,
|
||||
recorder: NewCanaryRecorder(false),
|
||||
}
|
||||
ctrl.flaggerSynced = alwaysReady
|
||||
|
||||
|
||||
@@ -8,6 +8,7 @@ import (
|
||||
"go.uber.org/zap/zapcore"
|
||||
)
|
||||
|
||||
// NewLogger returns a zap sugared logger configured with json format and caller id
|
||||
func NewLogger(logLevel string) (*zap.SugaredLogger, error) {
|
||||
level := zap.NewAtomicLevelAt(zapcore.InfoLevel)
|
||||
switch logLevel {
|
||||
@@ -59,6 +60,7 @@ func NewLogger(logLevel string) (*zap.SugaredLogger, error) {
|
||||
return logger.Sugar(), nil
|
||||
}
|
||||
|
||||
// Console writes to stdout if the console env var exists
|
||||
func Console(a ...interface{}) (n int, err error) {
|
||||
if os.Getenv("console") != "" {
|
||||
return fmt.Fprintln(os.Stdout, a...)
|
||||
|
||||
@@ -9,6 +9,7 @@ import (
|
||||
"go.uber.org/zap"
|
||||
)
|
||||
|
||||
// ListenAndServe starts a web server and waits for SIGTERM
|
||||
func ListenAndServe(port string, timeout time.Duration, logger *zap.SugaredLogger, stopCh <-chan struct{}) {
|
||||
mux := http.DefaultServeMux
|
||||
mux.Handle("/metrics", promhttp.Handler())
|
||||
|
||||
@@ -1,4 +1,4 @@
|
||||
package version
|
||||
|
||||
var VERSION = "0.1.0-beta.2"
|
||||
var VERSION = "0.1.0-beta.6"
|
||||
var REVISION = "unknown"
|
||||
|
||||
Reference in New Issue
Block a user