16 KiB
How it works
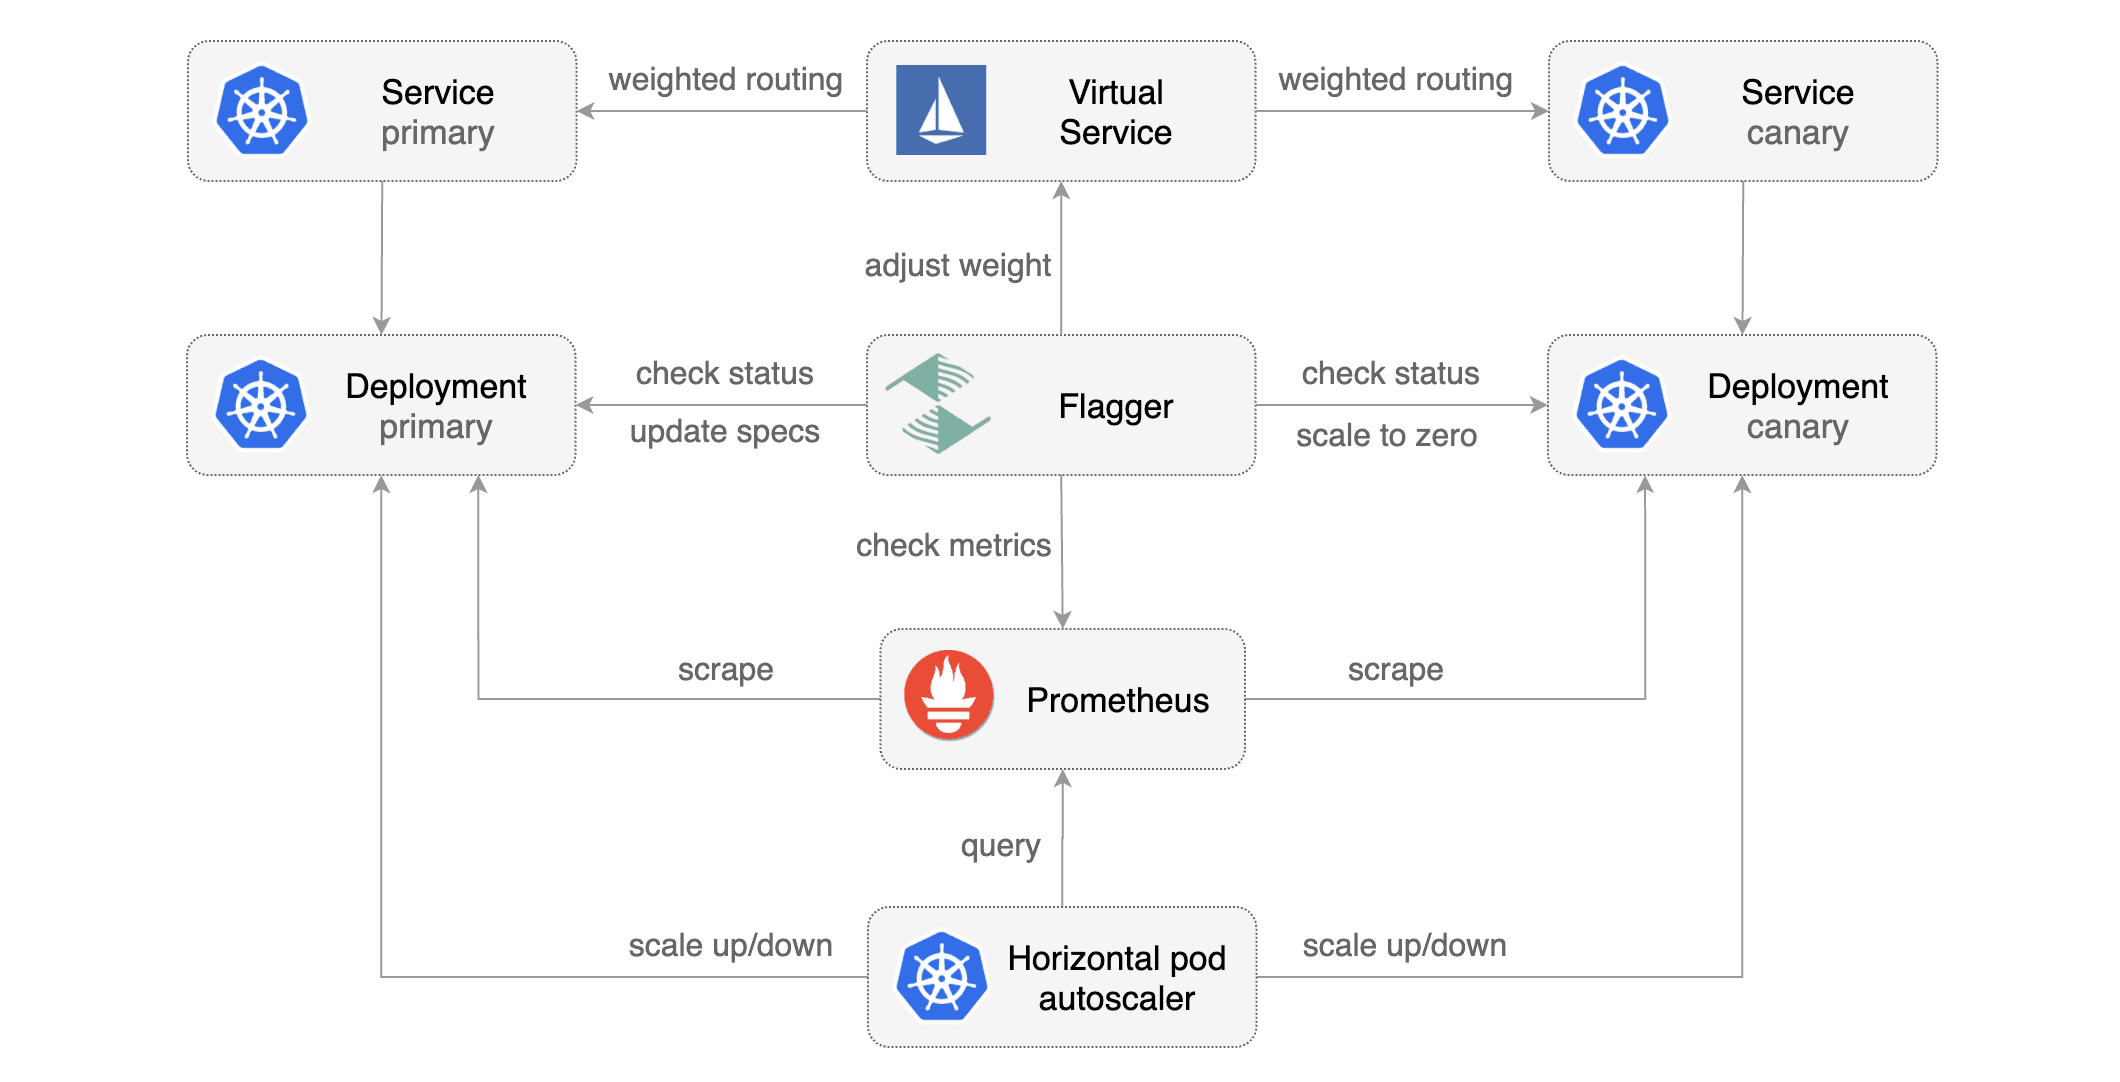
Flagger takes a Kubernetes deployment and optionally a horizontal pod autoscaler (HPA) and creates a series of objects (Kubernetes deployments, ClusterIP services and Istio virtual services) to drive the canary analysis and promotion.
Canary Custom Resource
For a deployment named podinfo, a canary promotion can be defined using Flagger's custom resource:
apiVersion: flagger.app/v1alpha3
kind: Canary
metadata:
  name: podinfo
  namespace: test
spec:
  # deployment reference
  targetRef:
    apiVersion: apps/v1
    kind: Deployment
    name: podinfo
  # the maximum time in seconds for the canary deployment
  # to make progress before it is rollback (default 600s)
  progressDeadlineSeconds: 60
  # HPA reference (optional)
  autoscalerRef:
    apiVersion: autoscaling/v2beta1
    kind: HorizontalPodAutoscaler
    name: podinfo
  service:
    # container port
    port: 9898
    # Istio gateways (optional)
    gateways:
    - public-gateway.istio-system.svc.cluster.local
    # Istio virtual service host names (optional)
    hosts:
    - podinfo.example.com
    # HTTP match conditions (optional)
    match:
      - uri:
          prefix: /
    # HTTP rewrite (optional)
    rewrite:
      uri: /
    # Envoy timeout and retry policy (optional)
    appendHeaders:
      x-envoy-upstream-rq-timeout-ms: "15000"
      x-envoy-max-retries: "10"
      x-envoy-retry-on: "gateway-error,connect-failure,refused-stream"
  # promote the canary without analysing it (default false)
  skipAnalysis: false
  # define the canary analysis timing and KPIs
  canaryAnalysis:
    # schedule interval (default 60s)
    interval: 1m
    # max number of failed metric checks before rollback
    threshold: 10
    # max traffic percentage routed to canary
    # percentage (0-100)
    maxWeight: 50
    # canary increment step
    # percentage (0-100)
    stepWeight: 5
    # Istio Prometheus checks
    metrics:
    - name: istio_requests_total
      # minimum req success rate (non 5xx responses)
      # percentage (0-100)
      threshold: 99
      interval: 1m
    - name: istio_request_duration_seconds_bucket
      # maximum req duration P99
      # milliseconds
      threshold: 500
      interval: 30s
    # external checks (optional)
    webhooks:
      - name: integration-tests
        url: http://podinfo.test:9898/echo
        timeout: 1m
        # key-value pairs (optional)
        metadata:
          test: "all"
          token: "16688eb5e9f289f1991c"
Note that the target deployment must have a single label selector in the format app: <DEPLOYMENT-NAME>:
apiVersion: apps/v1
kind: Deployment
metadata:
  name: podinfo
spec:
  selector:
    matchLabels:
      app: podinfo
  template:
    metadata:
      labels:
        app: podinfo
The target deployment should expose a TCP port that will be used by Flagger to create the ClusterIP Service and
the Istio Virtual Service. The container port from the target deployment should match the service.port value.
Virtual Service
Flagger creates an Istio Virtual Service based on the Canary service spec.
The following spec exposes the frontend workload inside the mesh on frontend.test.svc.cluster.local:9898
and outside the mesh on frontend.example.com. You'll have to specify an Istio ingress gateway for external hosts.
apiVersion: flagger.app/v1alpha3
kind: Canary
metadata:
  name: frontend
  namespace: test
  service:
    # container port
    port: 9898
    # Istio gateways (optional)
    gateways:
    - public-gateway.istio-system.svc.cluster.local
    # Istio virtual service host names (optional)
    hosts:
    - frontend.example.com
    # HTTP match conditions (optional)
    match:
      - uri:
          prefix: /
    # Envoy timeout and retry policy (optional)
    appendHeaders:
      x-envoy-upstream-rq-timeout-ms: "15000"
      x-envoy-max-retries: "10"
      x-envoy-retry-on: "gateway-error,connect-failure,refused-stream"
    # retry policy when a HTTP request fails (optional)
    retries:
      attempts: 3
      perTryTimeout: 3s
For the above spec Flagger will generate the following virtual service:
apiVersion: networking.istio.io/v1alpha3
kind: VirtualService
metadata:
  name: frontend
  namespace: test
  ownerReferences:
    - apiVersion: flagger.app/v1alpha3
      blockOwnerDeletion: true
      controller: true
      kind: Canary
      name: podinfo
      uid: 3a4a40dd-3875-11e9-8e1d-42010a9c0fd1
spec:
  gateways:
    - public-gateway.istio-system.svc.cluster.local
    - mesh
  hosts:
    - frontend.example.com
    - frontend
  http:
    - match:
        - uri:
            prefix: /
      rewrite:
        uri: /
      appendHeaders:
        x-envoy-upstream-rq-timeout-ms: "15000"
        x-envoy-max-retries: "10"
        x-envoy-retry-on: "gateway-error,connect-failure,refused-stream"
      route:
        - destination:
            host: frontend-primary
            port:
              number: 9898
          weight: 100
        - destination:
            host: frontend-canary
            port:
              number: 9898
          weight: 0
Flagger keeps in sync the virtual service with the canary service spec. Any direct modification of the virtual service spec will be overwritten.
To expose a workload inside the mesh on http://backend.test.svc.cluster.local:9898,
the service spec can contain only the container port:
apiVersion: flagger.app/v1alpha3
kind: Canary
metadata:
  name: backend
  namespace: test
spec:
  service:
    port: 9898
Based on the above spec, Flagger will create several ClusterIP services like:
apiVersion: v1
kind: Service
metadata:
  name: backend-primary
  ownerReferences:
  - apiVersion: flagger.app/v1alpha3
    blockOwnerDeletion: true
    controller: true
    kind: Canary
    name: backend
    uid: 2ca1a9c7-2ef6-11e9-bd01-42010a9c0145
spec:
  type: ClusterIP
  ports:
  - name: http
    port: 9898
    protocol: TCP
    targetPort: 9898
  selector:
    app: backend-primary
Flagger works for user facing apps exposed outside the cluster via an ingress gateway and for backend HTTP APIs that are accessible only from inside the mesh.
Canary Stages
A canary deployment is triggered by changes in any of the following objects:
- Deployment PodSpec (container image, command, ports, env, resources, etc)
- ConfigMaps mounted as volumes or mapped to environment variables
- Secrets mounted as volumes or mapped to environment variables
Gated canary promotion stages:
- scan for canary deployments
- check Istio virtual service routes are mapped to primary and canary ClusterIP services
- check primary and canary deployments status
- halt advancement if a rolling update is underway
- halt advancement if pods are unhealthy
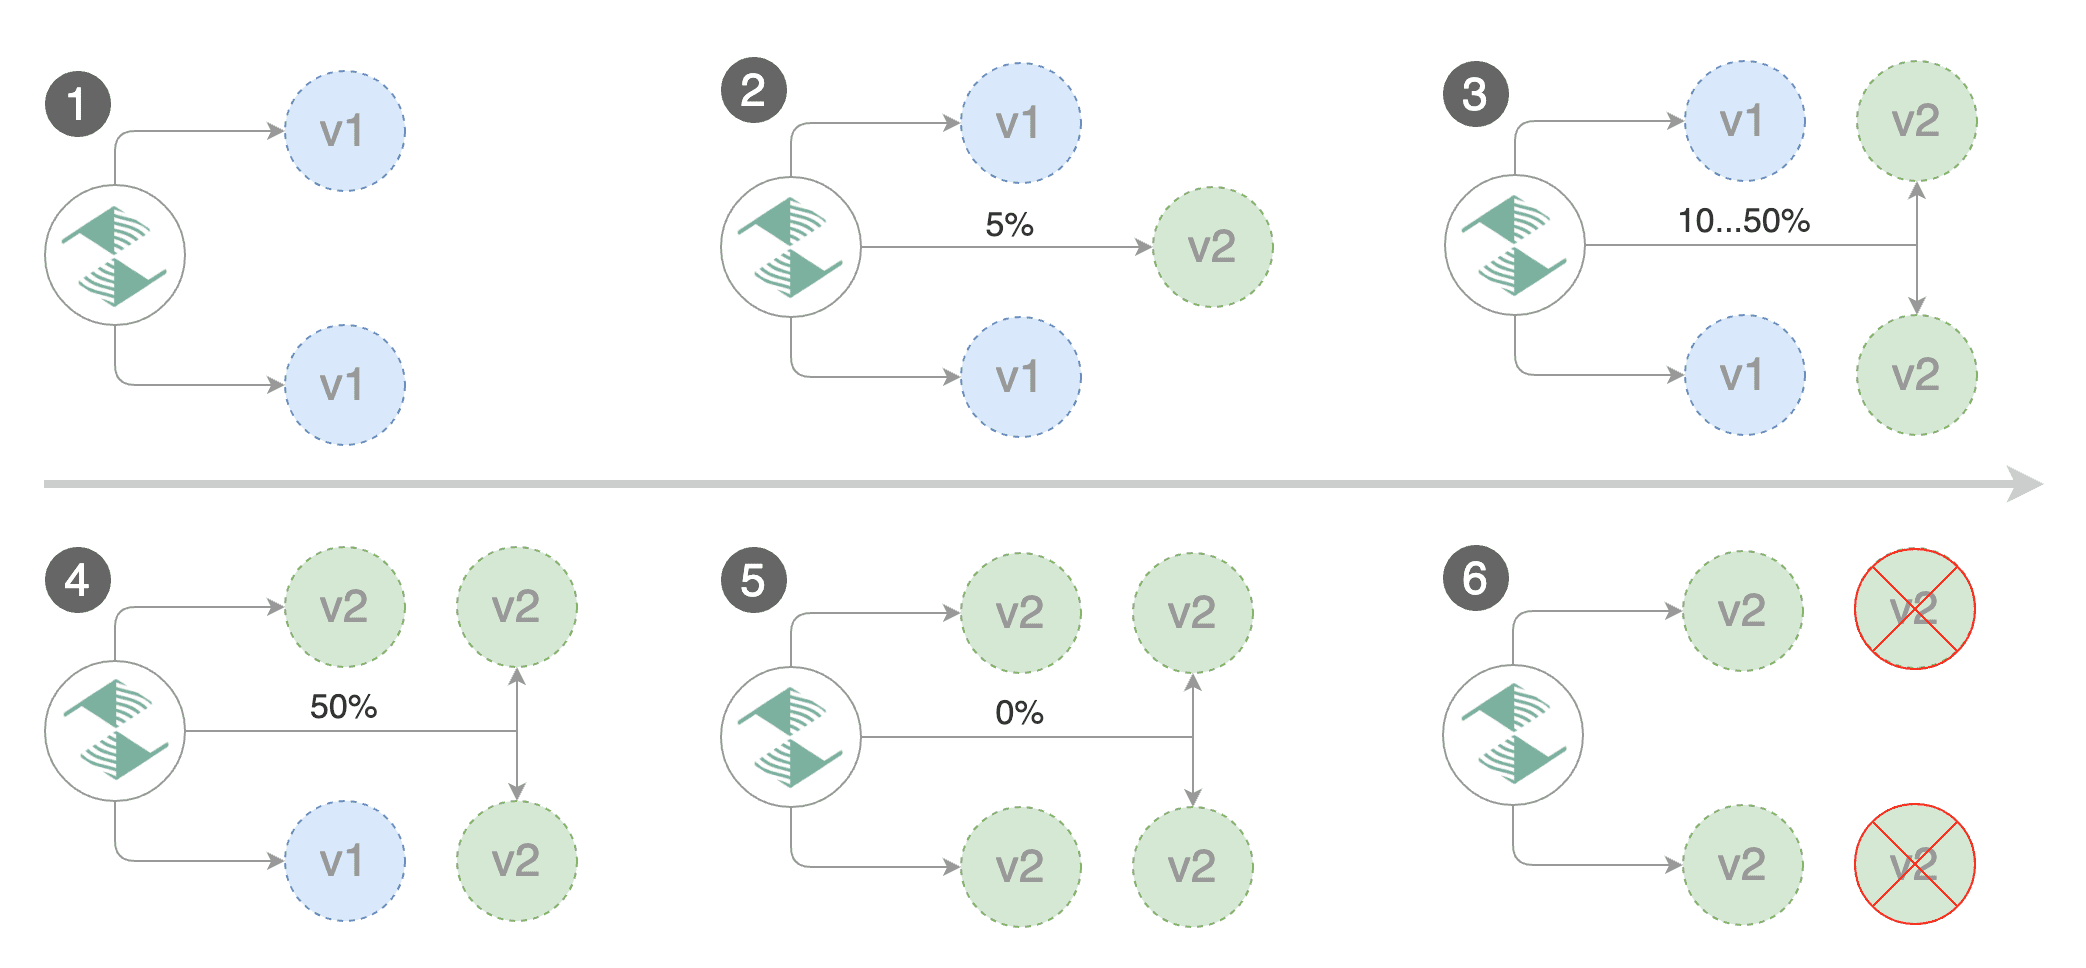
- increase canary traffic weight percentage from 0% to 5% (step weight)
- call webhooks and check results
- check canary HTTP request success rate and latency
- halt advancement if any metric is under the specified threshold
- increment the failed checks counter
- check if the number of failed checks reached the threshold
- route all traffic to primary
- scale to zero the canary deployment and mark it as failed
- wait for the canary deployment to be updated and start over
- increase canary traffic weight by 5% (step weight) till it reaches 50% (max weight)
- halt advancement while canary request success rate is under the threshold
- halt advancement while canary request duration P99 is over the threshold
- halt advancement if the primary or canary deployment becomes unhealthy
- halt advancement while canary deployment is being scaled up/down by HPA
- promote canary to primary
- copy ConfigMaps and Secrets from canary to primary
- copy canary deployment spec template over primary
- wait for primary rolling update to finish
- halt advancement if pods are unhealthy
- route all traffic to primary
- scale to zero the canary deployment
- mark rollout as finished
- wait for the canary deployment to be updated and start over
Canary Analysis
The canary analysis runs periodically until it reaches the maximum traffic weight or the failed checks threshold.
Spec:
  canaryAnalysis:
    # schedule interval (default 60s)
    interval: 1m
    # max number of failed metric checks before rollback
    threshold: 10
    # max traffic percentage routed to canary
    # percentage (0-100)
    maxWeight: 50
    # canary increment step
    # percentage (0-100)
    stepWeight: 2
  # deploy straight to production without
  # the metrics and webhook checks
  skipAnalysis: false
The above analysis, if it succeeds, will run for 25 minutes while validating the HTTP metrics and webhooks every minute. You can determine the minimum time that it takes to validate and promote a canary deployment using this formula:
interval * (maxWeight / stepWeight)
And the time it takes for a canary to be rollback when the metrics or webhook checks are failing:
interval * threshold
In emergency cases, you may want to skip the analysis phase and ship changes directly to production.
At any time you can set the spec.skipAnalysis: true.
When skip analysis is enabled, Flagger checks if the canary deployment is healthy and
promotes it without analysing it. If an analysis is underway, Flagger cancels it and runs the promotion.
HTTP Metrics
The canary analysis is using the following Prometheus queries:
HTTP requests success rate percentage
Spec:
  canaryAnalysis:
    metrics:
    - name: istio_requests_total
      # minimum req success rate (non 5xx responses)
      # percentage (0-100)
      threshold: 99
      interval: 1m
Query:
sum(
    rate(
        istio_requests_total{
          reporter="destination",
          destination_workload_namespace=~"$namespace",
          destination_workload=~"$workload",
          response_code!~"5.*"
        }[$interval]
    )
)
/
sum(
    rate(
        istio_requests_total{
          reporter="destination",
          destination_workload_namespace=~"$namespace",
          destination_workload=~"$workload"
        }[$interval]
    )
)
HTTP requests milliseconds duration P99
Spec:
  canaryAnalysis:
    metrics:
    - name: istio_request_duration_seconds_bucket
      # maximum req duration P99
      # milliseconds
      threshold: 500
      interval: 1m
Query:
histogram_quantile(0.99,
  sum(
    irate(
      istio_request_duration_seconds_bucket{
        reporter="destination",
        destination_workload=~"$workload",
        destination_workload_namespace=~"$namespace"
      }[$interval]
    )
  ) by (le)
)
Note
that the metric interval should be lower or equal to the control loop interval.
Custom Metrics
The canary analysis can be extended with custom Prometheus queries.
  canaryAnalysis:
    threshold: 1
    maxWeight: 50
    stepWeight: 5
    metrics:
    - name: "404s percentage"
      threshold: 5
      query: |
        100 - sum(
            rate(
                istio_requests_total{
                  reporter="destination",
                  destination_workload_namespace="test",
                  destination_workload="podinfo",
                  response_code!="404"
                }[1m]
            )
        )
        /
        sum(
            rate(
                istio_requests_total{
                  reporter="destination",
                  destination_workload_namespace="test",
                  destination_workload="podinfo"
                }[1m]
            )
        ) * 100
The above configuration validates the canary by checking if the HTTP 404 req/sec percentage is below 5 percent of the total traffic. If the 404s rate reaches the 5% threshold, then the canary fails.
When specifying a query, Flagger will run the promql query and convert the result to float64. Then it compares the query result value with the metric threshold value.
Webhooks
The canary analysis can be extended with webhooks. Flagger will call each webhook URL and determine from the response status code (HTTP 2xx) if the canary is failing or not.
Spec:
  canaryAnalysis:
    webhooks:
      - name: integration-test
        url: http://int-runner.test:8080/
        timeout: 30s
        metadata:
          test: "all"
          token: "16688eb5e9f289f1991c"
      - name: db-test
        url: http://migration-check.db/query
        timeout: 30s
        metadata:
          key1: "val1"
          key2: "val2"
Note
that the sum of all webhooks timeouts should be lower than the control loop interval.
Webhook payload (HTTP POST):
{
    "name": "podinfo",
    "namespace": "test",
    "metadata": {
        "test":  "all",
        "token":  "16688eb5e9f289f1991c"
    }
}
Response status codes:
- 200-202 - advance canary by increasing the traffic weight
- timeout or non-2xx - halt advancement and increment failed checks
On a non-2xx response Flagger will include the response body (if any) in the failed checks log and Kubernetes events.
Load Testing
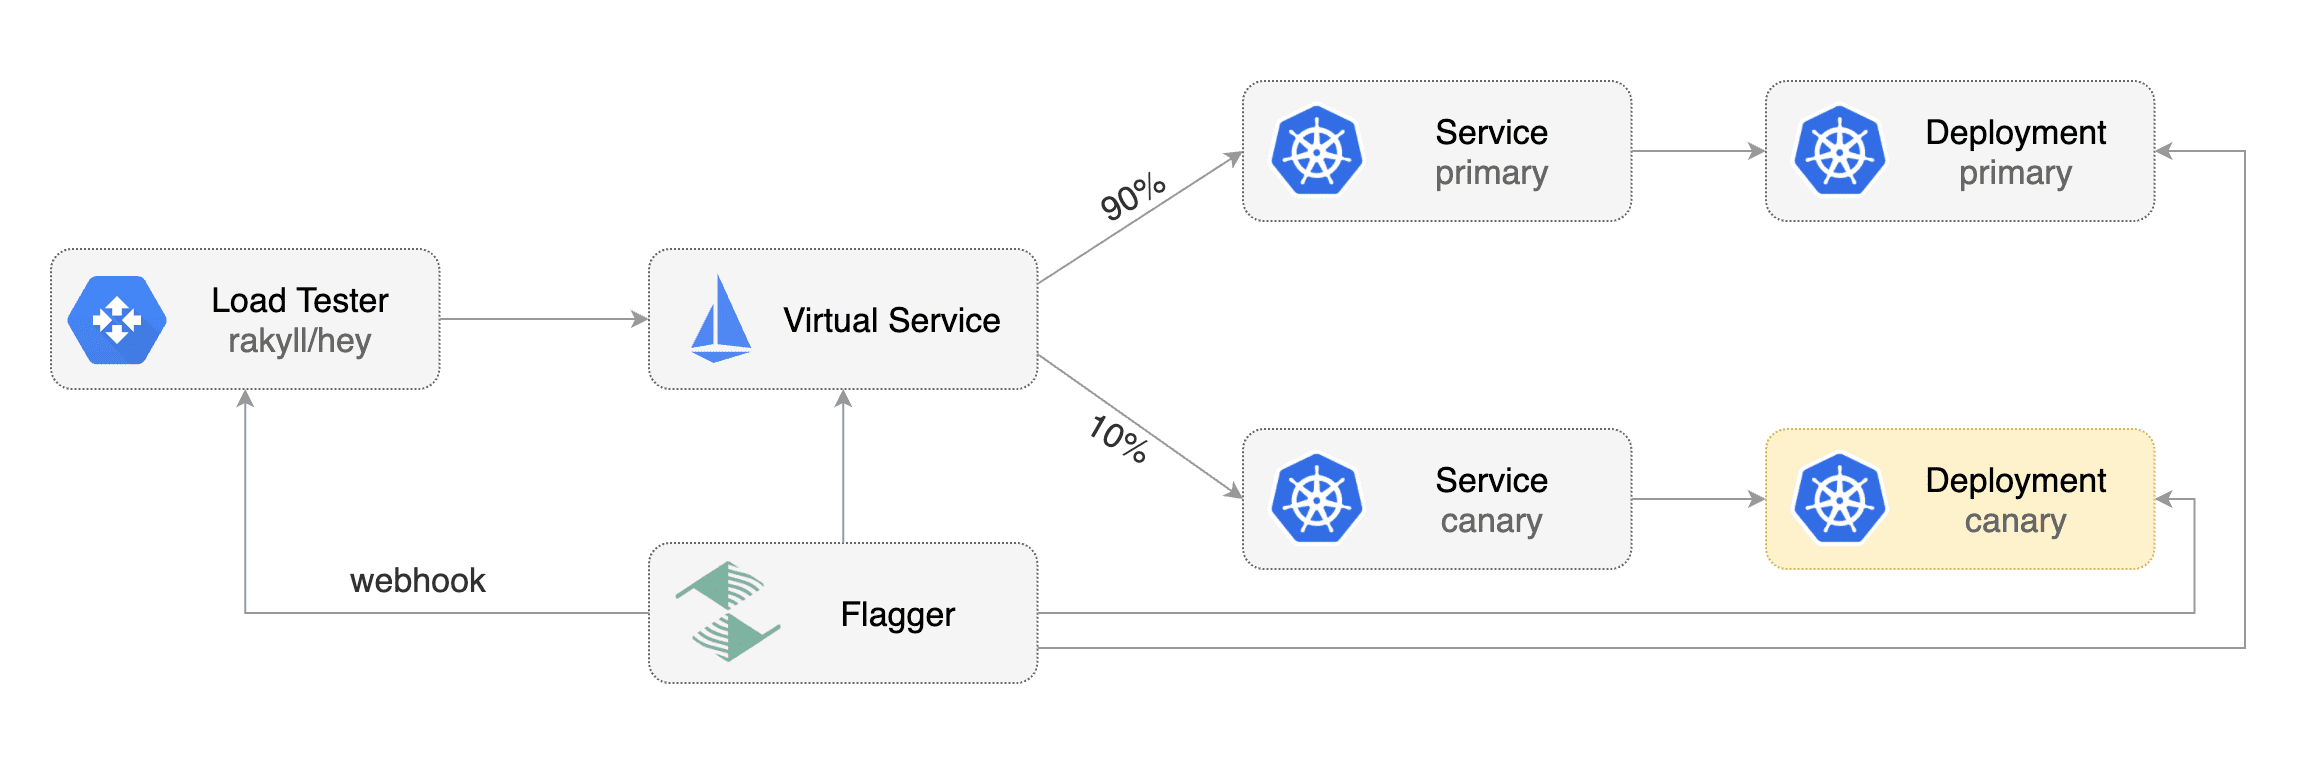
For workloads that are not receiving constant traffic Flagger can be configured with a webhook, that when called, will start a load test for the target workload. If the target workload doesn't receive any traffic during the canary analysis, Flagger metric checks will fail with "no values found for metric istio_requests_total".
Flagger comes with a load testing service based on rakyll/hey that generates traffic during analysis when configured as a webhook.
First you need to deploy the load test runner in a namespace with Istio sidecar injection enabled:
export REPO=https://raw.githubusercontent.com/stefanprodan/flagger/master

kubectl -n test apply -f ${REPO}/artifacts/loadtester/deployment.yaml
kubectl -n test apply -f ${REPO}/artifacts/loadtester/service.yaml
Or by using Helm:
helm repo add flagger https://flagger.app

helm upgrade -i flagger-loadtester flagger/loadtester \
--namepace=test \
--set cmd.logOutput=true \
--set cmd.timeout=1h
When deployed the load tester API will be available at http://flagger-loadtester.test/.
Now you can add webhooks to the canary analysis spec:
webhooks:
  - name: load-test-get
    url: http://flagger-loadtester.test/
    timeout: 5s
    metadata:
      cmd: "hey -z 1m -q 10 -c 2 http://podinfo.test:9898/"
  - name: load-test-post
    url: http://flagger-loadtester.test/
    timeout: 5s
    metadata:
      cmd: "hey -z 1m -q 10 -c 2 -m POST -d '{test: 2}' http://podinfo.test:9898/echo"
When the canary analysis starts, Flagger will call the webhooks and the load tester will run the hey commands
in the background, if they are not already running. This will ensure that during the
analysis, the podinfo.test virtual service will receive a steady steam of GET and POST requests.
If your workload is exposed outside the mesh with the Istio Gateway and TLS you can point hey to the
public URL and use HTTP2.
webhooks:
  - name: load-test-get
    url: http://flagger-loadtester.test/
    timeout: 5s
    metadata:
      cmd: "hey -z 1m -q 10 -c 2 -h2 https://podinfo.example.com/"
The load tester can run arbitrary commands as long as the binary is present in the container image.
For example if you you want to replace hey with another CLI, you can create your own Docker image:
FROM quay.io/stefanprodan/flagger-loadtester:<VER>

RUN curl -Lo /usr/local/bin/my-cli https://github.com/user/repo/releases/download/ver/my-cli \
    && chmod +x /usr/local/bin/my-cli