26 KiB
How it works
Flagger takes a Kubernetes deployment and optionally a horizontal pod autoscaler (HPA) and creates a series of objects (Kubernetes deployments, ClusterIP services, virtual service, traffic split or ingress) to drive the canary analysis and promotion.
Canary Custom Resource
For a deployment named podinfo, a canary promotion can be defined using Flagger's custom resource:
apiVersion: flagger.app/v1alpha3
kind: Canary
metadata:
  name: podinfo
  namespace: test
spec:
  # service mesh provider (optional)
  # can be: kubernetes, istio, linkerd, appmesh, nginx, gloo, supergloo
  provider: linkerd
  # deployment reference
  targetRef:
    apiVersion: apps/v1
    kind: Deployment
    name: podinfo
  # the maximum time in seconds for the canary deployment
  # to make progress before it is rollback (default 600s)
  progressDeadlineSeconds: 60
  # HPA reference (optional)
  autoscalerRef:
    apiVersion: autoscaling/v2beta1
    kind: HorizontalPodAutoscaler
    name: podinfo
  service:
    # ClusterIP port number
    port: 9898
    # ClusterIP port name can be http or grpc (default http)
    portName: http
    # container port number or name (optional)
    targetPort: 9898
    # add all the other container ports
    # to the ClusterIP services (default false)
    portDiscovery: false
  # promote the canary without analysing it (default false)
  skipAnalysis: false
  # define the canary analysis timing and KPIs
  canaryAnalysis:
    # schedule interval (default 60s)
    interval: 1m
    # max number of failed metric checks before rollback
    threshold: 10
    # max traffic percentage routed to canary
    # percentage (0-100)
    maxWeight: 50
    # canary increment step
    # percentage (0-100)
    stepWeight: 5
    # Prometheus checks
    metrics:
    - name: request-success-rate
      # minimum req success rate (non 5xx responses)
      # percentage (0-100)
      threshold: 99
      interval: 1m
    - name: request-duration
      # maximum req duration P99
      # milliseconds
      threshold: 500
      interval: 30s
    # testing (optional)
    webhooks:
      - name: load-test
        url: http://flagger-loadtester.test/
        timeout: 5s
        metadata:
          cmd: "hey -z 1m -q 10 -c 2 http://podinfo.test:9898/"
Note that the target deployment must have a single label selector in the format app: <DEPLOYMENT-NAME>:
apiVersion: apps/v1
kind: Deployment
metadata:
  name: podinfo
spec:
  selector:
    matchLabels:
      app: podinfo
  template:
    metadata:
      labels:
        app: podinfo
Besides app Flagger supports name and app.kubernetes.io/name selectors. If you use a different
convention you can specify your label with the -selector-labels flag.
The target deployment should expose a TCP port that will be used by Flagger to create the ClusterIP Services.
The container port from the target deployment should match the service.port or service.targetPort.
Canary status
Get the current status of canary deployments cluster wide:
kubectl get canaries --all-namespaces

NAMESPACE   NAME      STATUS        WEIGHT   LASTTRANSITIONTIME
test        podinfo   Progressing   15       2019-06-30T14:05:07Z
prod        frontend  Succeeded     0        2019-06-30T16:15:07Z
prod        backend   Failed        0        2019-06-30T17:05:07Z
The status condition reflects the last know state of the canary analysis:
kubectl -n test get canary/podinfo -oyaml | awk '/status/,0'
A successful rollout status:
status:
  canaryWeight: 0
  failedChecks: 0
  iterations: 0
  lastAppliedSpec: "14788816656920327485"
  lastPromotedSpec: "14788816656920327485"
  conditions:
  - lastTransitionTime: "2019-07-10T08:23:18Z"
    lastUpdateTime: "2019-07-10T08:23:18Z"
    message: Canary analysis completed successfully, promotion finished.
    reason: Succeeded
    status: "True"
    type: Promoted
The Promoted status condition can have one of the following reasons:
Initialized, Waiting, Progressing, Promoting, Finalising, Succeeded or Failed.
A failed canary will have the promoted status set to false,
the reason to failed and the last applied spec will be different to the last promoted one.
Wait for a successful rollout:
kubectl wait canary/podinfo --for=condition=promoted
CI example:
# update the container image
kubectl set image deployment/podinfo podinfod=stefanprodan/podinfo:3.0.1

# wait for Flagger to detect the change
ok=false
until ${ok}; do
    kubectl get canary/podinfo | grep 'Progressing' && ok=true || ok=false
    sleep 5
done

# wait for the canary analysis to finish
kubectl wait canary/podinfo --for=condition=promoted --timeout=5m

# check if the deployment was successful
kubectl get canary/podinfo | grep Succeeded
Canary Stages
A canary deployment is triggered by changes in any of the following objects:
- Deployment PodSpec (container image, command, ports, env, resources, etc)
- ConfigMaps mounted as volumes or mapped to environment variables
- Secrets mounted as volumes or mapped to environment variables
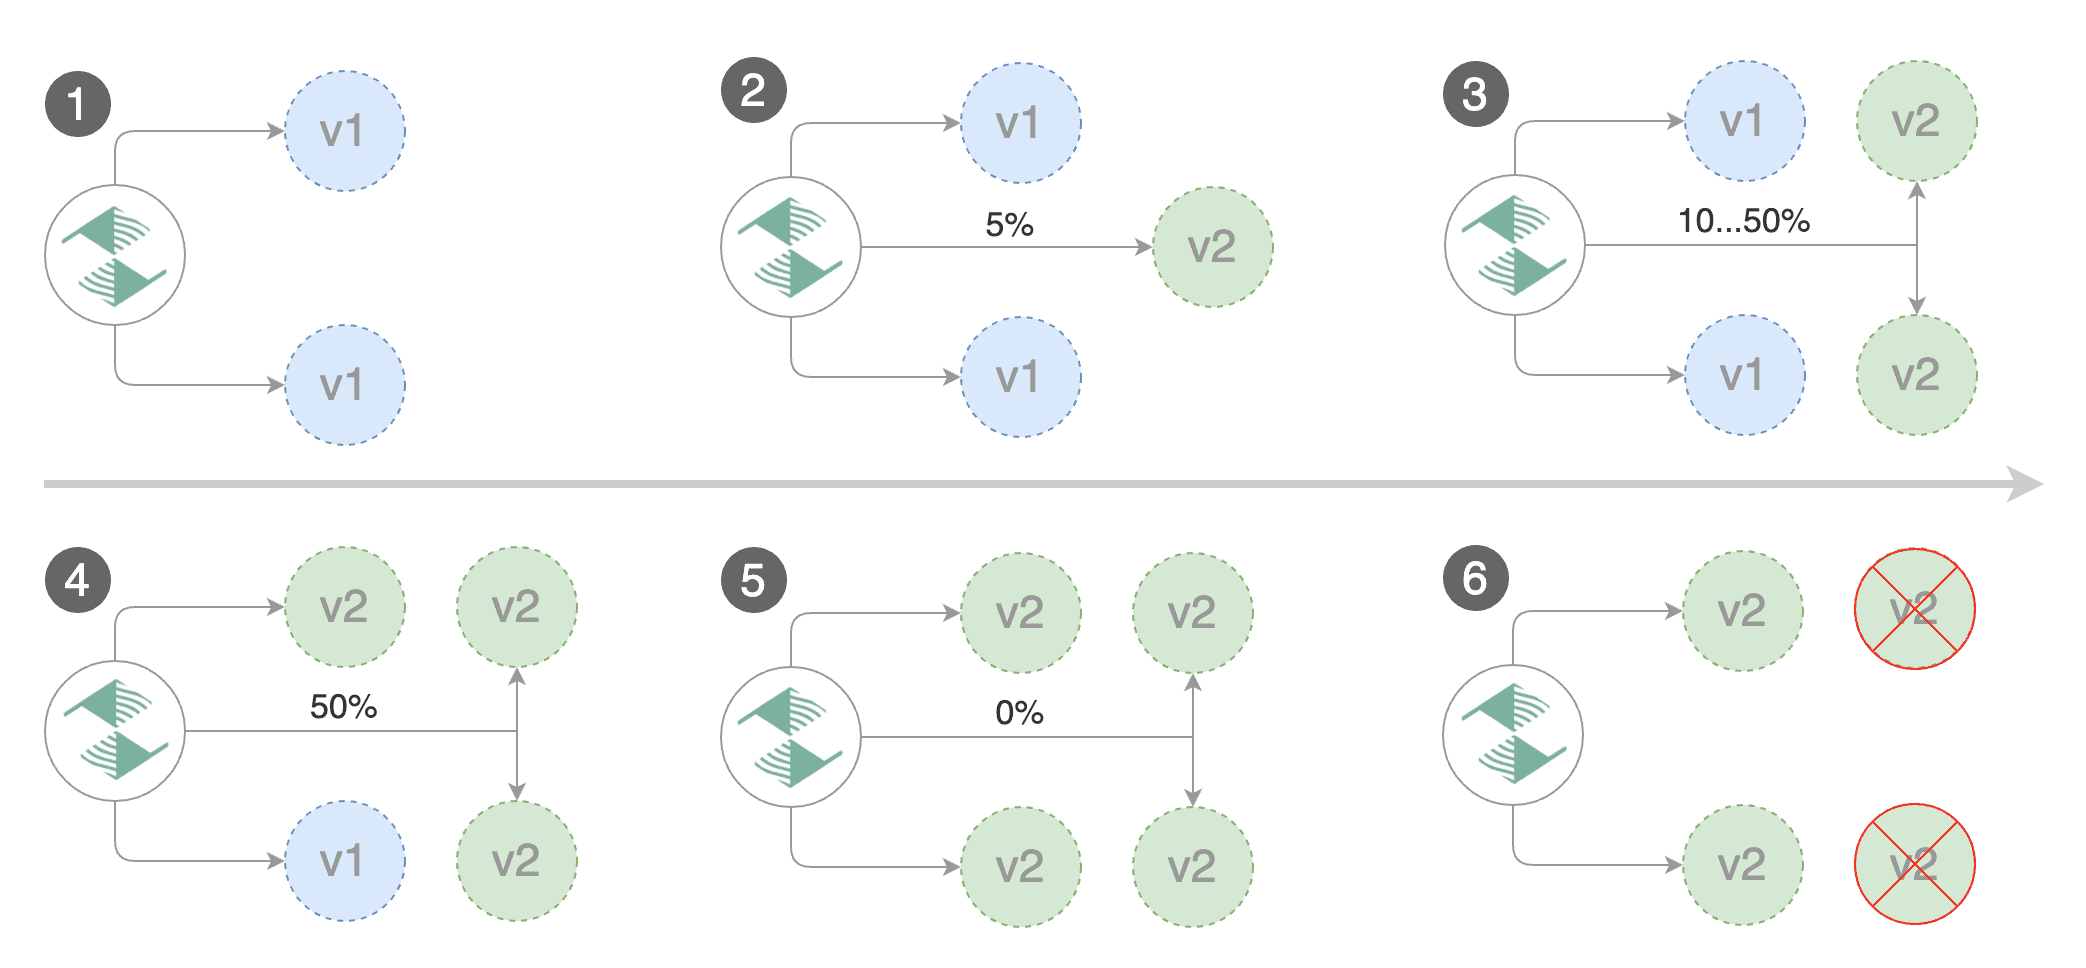
Gated canary promotion stages:
- scan for canary deployments
- check primary and canary deployment status
- halt advancement if a rolling update is underway
- halt advancement if pods are unhealthy
- call confirm-rollout webhooks and check results
- halt advancement if any hook returns a non HTTP 2xx result
- call pre-rollout webhooks and check results
- halt advancement if any hook returns a non HTTP 2xx result
- increment the failed checks counter
- increase canary traffic weight percentage from 0% to 5% (step weight)
- call rollout webhooks and check results
- check canary HTTP request success rate and latency
- halt advancement if any metric is under the specified threshold
- increment the failed checks counter
- check if the number of failed checks reached the threshold
- route all traffic to primary
- scale to zero the canary deployment and mark it as failed
- call post-rollout webhooks
- post the analysis result to Slack
- wait for the canary deployment to be updated and start over
- increase canary traffic weight by 5% (step weight) till it reaches 50% (max weight)
- halt advancement if any webhook call fails
- halt advancement while canary request success rate is under the threshold
- halt advancement while canary request duration P99 is over the threshold
- halt advancement while any custom metric check fails
- halt advancement if the primary or canary deployment becomes unhealthy
- halt advancement while canary deployment is being scaled up/down by HPA
- call confirm-promotion webhooks and check results
- halt advancement if any hook returns a non HTTP 2xx result
- promote canary to primary
- copy ConfigMaps and Secrets from canary to primary
- copy canary deployment spec template over primary
- wait for primary rolling update to finish
- halt advancement if pods are unhealthy
- route all traffic to primary
- scale to zero the canary deployment
- mark rollout as finished
- call post-rollout webhooks
- post the analysis result to Slack or MS Teams
- wait for the canary deployment to be updated and start over
Canary Analysis
The canary analysis runs periodically until it reaches the maximum traffic weight or the failed checks threshold.
Spec:
  canaryAnalysis:
    # schedule interval (default 60s)
    interval: 1m
    # max number of failed metric checks before rollback
    threshold: 10
    # max traffic percentage routed to canary
    # percentage (0-100)
    maxWeight: 50
    # canary increment step
    # percentage (0-100)
    stepWeight: 2
  # deploy straight to production without
  # the metrics and webhook checks
  skipAnalysis: false
The above analysis, if it succeeds, will run for 25 minutes while validating the HTTP metrics and webhooks every minute. You can determine the minimum time that it takes to validate and promote a canary deployment using this formula:
interval * (maxWeight / stepWeight)
And the time it takes for a canary to be rollback when the metrics or webhook checks are failing:
interval * threshold
In emergency cases, you may want to skip the analysis phase and ship changes directly to production.
At any time you can set the spec.skipAnalysis: true.
When skip analysis is enabled, Flagger checks if the canary deployment is healthy and
promotes it without analysing it. If an analysis is underway, Flagger cancels it and runs the promotion.
A/B Testing
Besides weighted routing, Flagger can be configured to route traffic to the canary based on HTTP match conditions. In an A/B testing scenario, you'll be using HTTP headers or cookies to target a certain segment of your users. This is particularly useful for frontend applications that require session affinity.
You can enable A/B testing by specifying the HTTP match conditions and the number of iterations:
  canaryAnalysis:
    # schedule interval (default 60s)
    interval: 1m
    # total number of iterations
    iterations: 10
    # max number of failed iterations before rollback
    threshold: 2
    # canary match condition
    match:
      - headers:
          user-agent:
            regex: "^(?!.*Chrome).*Safari.*"
      - headers:
          cookie:
            regex: "^(.*?;)?(user=test)(;.*)?$"
If Flagger finds a HTTP match condition, it will ignore the maxWeight and stepWeight settings.
The above configuration will run an analysis for ten minutes targeting the Safari users and those that have a test cookie. You can determine the minimum time that it takes to validate and promote a canary deployment using this formula:
interval * iterations
And the time it takes for a canary to be rollback when the metrics or webhook checks are failing:
interval * threshold
Make sure that the analysis threshold is lower than the number of iterations.
Blue/Green deployments
For applications that are not deployed on a service mesh, Flagger can orchestrate blue/green style deployments with Kubernetes L4 networking. When using Istio you have the option to mirror traffic between blue and green.
You can use the blue/green deployment strategy by replacing stepWeight/maxWeight with iterations in the canaryAnalysis spec:
  canaryAnalysis:
    # schedule interval (default 60s)
    interval: 1m
    # total number of iterations
    iterations: 10
    # max number of failed iterations before rollback
    threshold: 2
    # Traffic shadowing (compatible with Istio only)
    mirror: true
With the above configuration Flagger will run conformance and load tests on the canary pods for ten minutes. If the metrics analysis succeeds, live traffic will be switched from the old version to the new one when the canary is promoted.
HTTP Metrics
The canary analysis is using the following Prometheus queries:
HTTP requests success rate percentage
Spec:
  canaryAnalysis:
    metrics:
    - name: request-success-rate
      # minimum req success rate (non 5xx responses)
      # percentage (0-100)
      threshold: 99
      interval: 1m
Istio query:
sum(
    rate(
        istio_requests_total{
          reporter="destination",
          destination_workload_namespace=~"$namespace",
          destination_workload=~"$workload",
          response_code!~"5.*"
        }[$interval]
    )
)
/
sum(
    rate(
        istio_requests_total{
          reporter="destination",
          destination_workload_namespace=~"$namespace",
          destination_workload=~"$workload"
        }[$interval]
    )
)
Envoy query (App Mesh or Gloo):
sum(
    rate(
        envoy_cluster_upstream_rq{
          kubernetes_namespace="$namespace",
          kubernetes_pod_name=~"$workload",
          envoy_response_code!~"5.*"
        }[$interval]
    )
)
/
sum(
    rate(
        envoy_cluster_upstream_rq{
          kubernetes_namespace="$namespace",
          kubernetes_pod_name=~"$workload"
        }[$interval]
    )
)
HTTP requests milliseconds duration P99
Spec:
  canaryAnalysis:
    metrics:
    - name: request-duration
      # maximum req duration P99
      # milliseconds
      threshold: 500
      interval: 1m
Istio query:
histogram_quantile(0.99,
  sum(
    irate(
      istio_request_duration_seconds_bucket{
        reporter="destination",
        destination_workload=~"$workload",
        destination_workload_namespace=~"$namespace"
      }[$interval]
    )
  ) by (le)
)
Envoy query (App Mesh or Gloo):
histogram_quantile(0.99,
  sum(
    irate(
      envoy_cluster_upstream_rq_time_bucket{
        kubernetes_pod_name=~"$workload",
        kubernetes_namespace=~"$namespace"
      }[$interval]
    )
  ) by (le)
)
Note
that the metric interval should be lower or equal to the control loop interval.
Custom Metrics
The canary analysis can be extended with custom Prometheus queries.
  canaryAnalysis:
    threshold: 1
    maxWeight: 50
    stepWeight: 5
    metrics:
    - name: "404s percentage"
      threshold: 5
      query: |
        100 - sum(
            rate(
                istio_requests_total{
                  reporter="destination",
                  destination_workload_namespace="test",
                  destination_workload="podinfo",
                  response_code!="404"
                }[1m]
            )
        )
        /
        sum(
            rate(
                istio_requests_total{
                  reporter="destination",
                  destination_workload_namespace="test",
                  destination_workload="podinfo"
                }[1m]
            )
        ) * 100
The above configuration validates the canary by checking if the HTTP 404 req/sec percentage is below 5 percent of the total traffic. If the 404s rate reaches the 5% threshold, then the canary fails.
  canaryAnalysis:
    threshold: 1
    maxWeight: 50
    stepWeight: 5
    metrics:
    - name: "rpc error rate"
      threshold: 5
      query: |
        100 - (sum
            rate(
                grpc_server_handled_total{
                  grpc_service="my.TestService",
                  grpc_code!="OK"
                }[1m]
            )
        )
        /
        sum(
            rate(
                grpc_server_started_total{
                  grpc_service="my.TestService"
                }[1m]
            )
        ) * 100
The above configuration validates the canary by checking if the percentage of non-OK GRPC req/sec is below 5 percent of the total requests. If the non-OK rate reaches the 5% threshold, then the canary fails.
When specifying a query, Flagger will run the promql query and convert the result to float64. Then it compares the query result value with the metric threshold value.
Webhooks
The canary analysis can be extended with webhooks. Flagger will call each webhook URL and determine from the response status code (HTTP 2xx) if the canary is failing or not.
There are three types of hooks:
- Confirm-rollout hooks are executed before scaling up the canary deployment and ca be used for manual approval. The rollout is paused until the hook returns a successful HTTP status code.
- Pre-rollout hooks are executed before routing traffic to canary. The canary advancement is paused if a pre-rollout hook fails and if the number of failures reach the threshold the canary will be rollback.
- Rollout hooks are executed during the analysis on each iteration before the metric checks. If a rollout hook call fails the canary advancement is paused and eventfully rolled back.
- Confirm-promotion hooks are executed before the promotion step. The canary promotion is paused until the hooks return HTTP 200. While the promotion is paused, Flagger will continue to run the metrics checks and rollout hooks.
- Post-rollout hooks are executed after the canary has been promoted or rolled back. If a post rollout hook fails the error is logged.
Spec:
  canaryAnalysis:
    webhooks:
      - name: "start gate"
        type: confirm-rollout
        url: http://flagger-loadtester.test/gate/approve
      - name: "smoke test"
        type: pre-rollout
        url: http://flagger-helmtester.kube-system/
        timeout: 3m
        metadata:
          type: "helm"
          cmd: "test podinfo --cleanup"
      - name: "load test"
        type: rollout
        url: http://flagger-loadtester.test/
        timeout: 15s
        metadata:
          cmd: "hey -z 1m -q 5 -c 2 http://podinfo-canary.test:9898/"
      - name: "promotion gate"
        type: confirm-promotion
        url: http://flagger-loadtester.test/gate/approve
      - name: "notify"
        type: post-rollout
        url: http://telegram.bot:8080/
        timeout: 5s
        metadata:
          some: "message"
Note
that the sum of all rollout webhooks timeouts should be lower than the analysis interval.
Webhook payload (HTTP POST):
{
    "name": "podinfo",
    "namespace": "test",
    "phase": "Progressing",
    "metadata": {
        "test":  "all",
        "token":  "16688eb5e9f289f1991c"
    }
}
Response status codes:
- 200-202 - advance canary by increasing the traffic weight
- timeout or non-2xx - halt advancement and increment failed checks
On a non-2xx response Flagger will include the response body (if any) in the failed checks log and Kubernetes events.
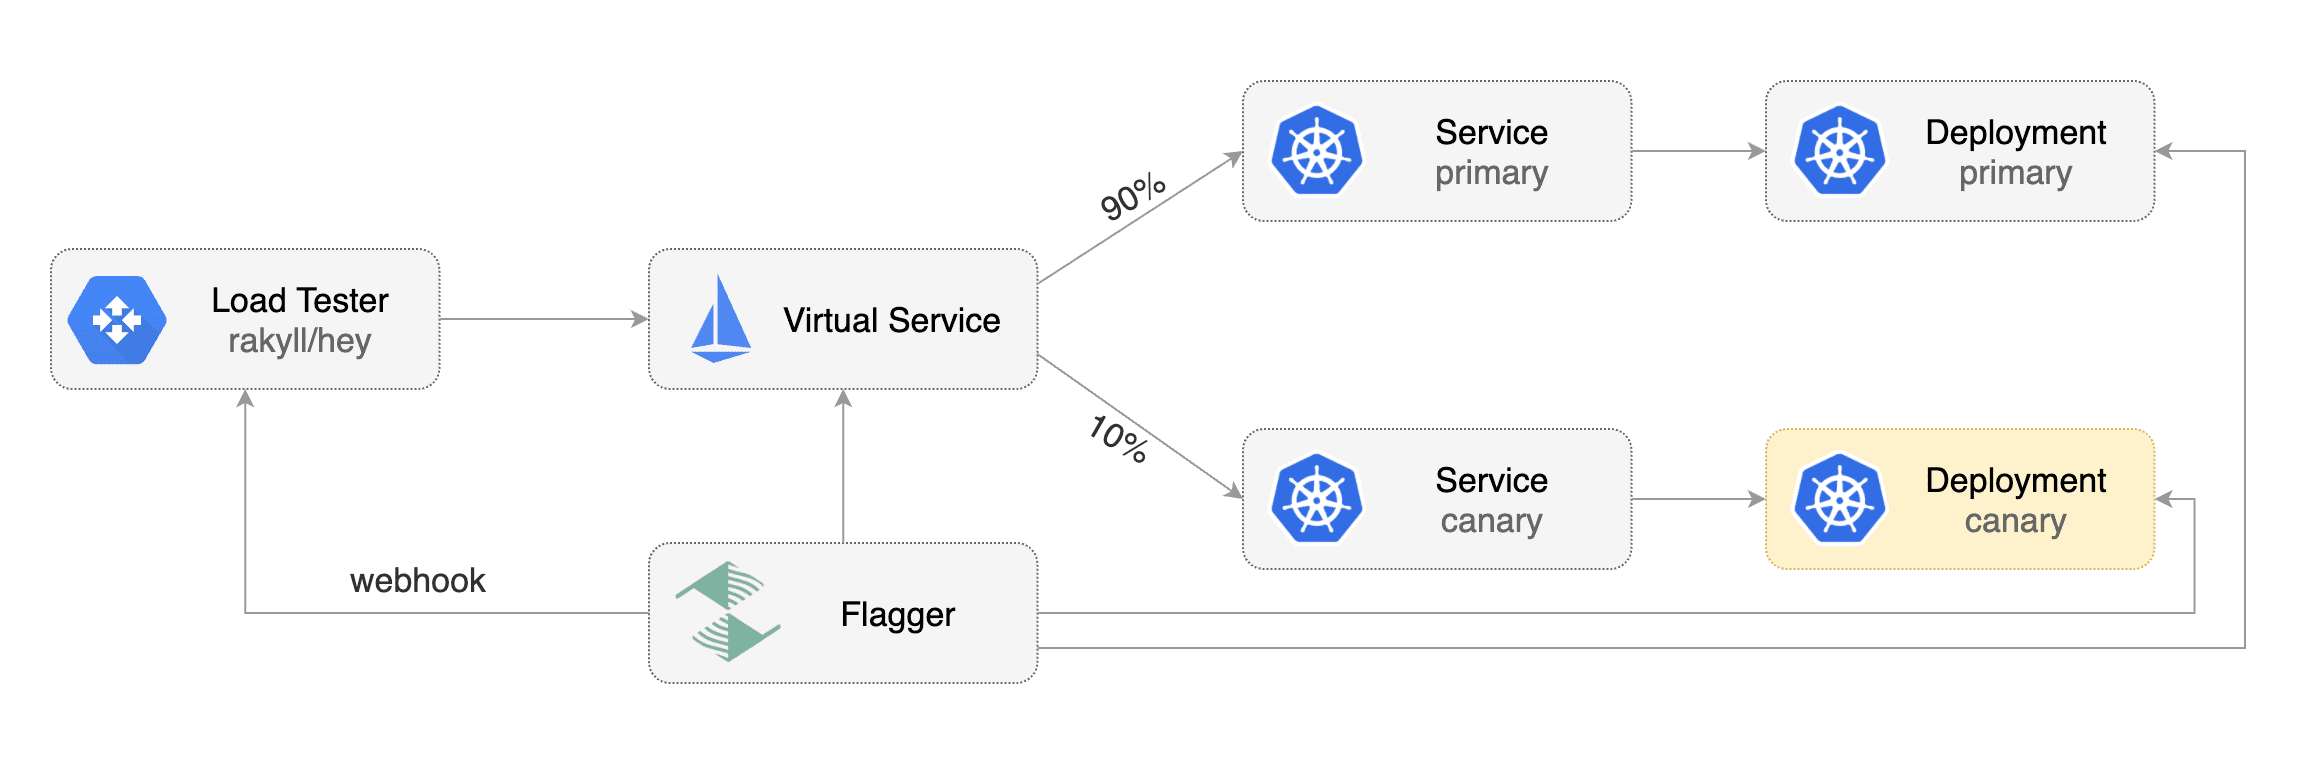
Load Testing
For workloads that are not receiving constant traffic Flagger can be configured with a webhook, that when called, will start a load test for the target workload. If the target workload doesn't receive any traffic during the canary analysis, Flagger metric checks will fail with "no values found for metric request-success-rate".
Flagger comes with a load testing service based on rakyll/hey that generates traffic during analysis when configured as a webhook.
First you need to deploy the load test runner in a namespace with sidecar injection enabled:
export REPO=https://raw.githubusercontent.com/weaveworks/flagger/master

kubectl -n test apply -f ${REPO}/artifacts/loadtester/deployment.yaml
kubectl -n test apply -f ${REPO}/artifacts/loadtester/service.yaml
Or by using Helm:
helm repo add flagger https://flagger.app

helm upgrade -i flagger-loadtester flagger/loadtester \
--namespace=test \
--set cmd.timeout=1h
When deployed the load tester API will be available at http://flagger-loadtester.test/.
Now you can add webhooks to the canary analysis spec:
webhooks:
  - name: load-test-get
    url: http://flagger-loadtester.test/
    timeout: 5s
    metadata:
      type: cmd
      cmd: "hey -z 1m -q 10 -c 2 http://podinfo-canary.test:9898/"
  - name: load-test-post
    url: http://flagger-loadtester.test/
    timeout: 5s
    metadata:
      type: cmd
      cmd: "hey -z 1m -q 10 -c 2 -m POST -d '{test: 2}' http://podinfo-canary.test:9898/echo"
When the canary analysis starts, Flagger will call the webhooks and the load tester will run the hey commands
in the background, if they are not already running. This will ensure that during the
analysis, the podinfo-canary.test service will receive a steady stream of GET and POST requests.
If your workload is exposed outside the mesh you can point hey to the
public URL and use HTTP2.
webhooks:
  - name: load-test-get
    url: http://flagger-loadtester.test/
    timeout: 5s
    metadata:
      type: cmd
      cmd: "hey -z 1m -q 10 -c 2 -h2 https://podinfo.example.com/"
For gRPC services you can use bojand/ghz which is a similar tool to Hey but for gPRC:
webhooks:
  - name: grpc-load-test
    url: http://flagger-loadtester.test/
    timeout: 5s
    metadata:
      type: cmd
      cmd: "ghz -z 1m -q 10 -c 2 --insecure podinfo.test:9898"
ghz uses reflection to identify which gRPC method to call. If you do not wish to enable reflection for your gRPC service you can implement a standardized health check from the grpc-proto library. To use this health check schema without reflection you can pass a parameter to ghz like this
webhooks:
  - name: grpc-load-test-no-reflection
    url: http://flagger-loadtester.test/
    timeout: 5s
    metadata:
      type: cmd
      cmd: "ghz --insecure --proto=/tmp/ghz/health.proto --call=grpc.health.v1.Health/Check podinfo.test:9898"
The load tester can run arbitrary commands as long as the binary is present in the container image.
For example if you you want to replace hey with another CLI, you can create your own Docker image:
FROM weaveworks/flagger-loadtester:<VER>

RUN curl -Lo /usr/local/bin/my-cli https://github.com/user/repo/releases/download/ver/my-cli \
    && chmod +x /usr/local/bin/my-cli
Load Testing Delegation
The load tester can also forward testing tasks to external tools, by now nGrinder is supported.
To use this feature, add a load test task of type 'ngrinder' to the canary analysis spec:
webhooks:
  - name: load-test-post
    url: http://flagger-loadtester.test/
    timeout: 5s
    metadata:
      # type of this load test task, cmd or ngrinder
      type: ngrinder
      # base url of your nGrinder controller server
      server: http://ngrinder-server:port
      # id of the test to clone from, the test must have been defined.
      clone: 100
      # user name and base64 encoded password to authenticate against the nGrinder server
      username: admin
      passwd: YWRtaW4=
      # the interval between between nGrinder test status polling, default to 1s
      pollInterval: 5s
When the canary analysis starts, the load tester will initiate a clone_and_start request to the nGrinder server and start a new performance test. the load tester will periodically poll the nGrinder server for the status of the test, and prevent duplicate requests from being sent in subsequent analysis loops.
Integration Testing
Flagger comes with a testing service that can run Helm tests or Bats tests when configured as a webhook.
Deploy the Helm test runner in the kube-system namespace using the tiller service account:
helm repo add flagger https://flagger.app

helm upgrade -i flagger-helmtester flagger/loadtester \
--namespace=kube-system \
--set serviceAccountName=tiller
When deployed the Helm tester API will be available at http://flagger-helmtester.kube-system/.
Now you can add pre-rollout webhooks to the canary analysis spec:
  canaryAnalysis:
    webhooks:
      - name: "smoke test"
        type: pre-rollout
        url: http://flagger-helmtester.kube-system/
        timeout: 3m
        metadata:
          type: "helm"
          cmd: "test {{ .Release.Name }} --cleanup"
When the canary analysis starts, Flagger will call the pre-rollout webhooks before routing traffic to the canary. If the helm test fails, Flagger will retry until the analysis threshold is reached and the canary is rolled back.
If you are using Helm v3, you'll have to create a dedicated service account and add the release namespace to the test command:
  canaryAnalysis:
    webhooks:
      - name: "smoke test"
        type: pre-rollout
        url: http://flagger-helmtester.kube-system/
        timeout: 3m
        metadata:
          type: "helmv3"
          cmd: "test run {{ .Release.Name }} --cleanup -n {{ .Release.Namespace }}"
As an alternative to Helm you can use the Bash Automated Testing System to run your tests.
  canaryAnalysis:
    webhooks:
      - name: "acceptance tests"
        type: pre-rollout
        url: http://flagger-batstester.default/
        timeout: 5m
        metadata:
          type: "bash"
          cmd: "bats /tests/acceptance.bats"
Note that you should create a ConfigMap with your Bats tests and mount it inside the tester container.
Manual Gating
For manual approval of a canary deployment you can use the confirm-rollout and confirm-promotion webhooks.
The confirmation rollout hooks are executed before the pre-rollout hooks.
Flagger will halt the canary traffic shifting and analysis until the confirm webhook returns HTTP status 200.
Manual gating with Flagger's tester:
  canaryAnalysis:
    webhooks:
      - name: "gate"
        type: confirm-rollout
        url: http://flagger-loadtester.test/gate/halt
The /gate/halt returns HTTP 403 thus blocking the rollout.
If you have notifications enabled, Flagger will post a message to Slack or MS Teams if a canary rollout is waiting for approval.
Change the URL to /gate/approve to start the canary analysis:
  canaryAnalysis:
    webhooks:
      - name: "gate"
        type: confirm-rollout
        url: http://flagger-loadtester.test/gate/approve
Manual gating can be driven with Flagger's tester API. Set the confirmation URL to /gate/check:
  canaryAnalysis:
    webhooks:
      - name: "ask for confirmation"
        type: confirm-rollout
        url: http://flagger-loadtester.test/gate/check
By default the gate is closed, you can start or resume the canary rollout with:
kubectl -n test exec -it flagger-loadtester-xxxx-xxxx sh

curl -d '{"name": "podinfo","namespace":"test"}' http://localhost:8080/gate/open
You can pause the rollout at any time with:
curl -d '{"name": "podinfo","namespace":"test"}' http://localhost:8080/gate/close
If a canary analysis is paused the status will change to waiting:
kubectl get canary/podinfo

NAME      STATUS        WEIGHT
podinfo   Waiting       0
The confirm-promotion hook type can be used to manually approve the canary promotion.
While the promotion is paused, Flagger will continue to run the metrics checks and load tests.
  canaryAnalysis:
    webhooks:
      - name: "promotion gate"
        type: confirm-promotion
        url: http://flagger-loadtester.test/gate/halt
If you have notifications enabled, Flagger will post a message to Slack or MS Teams if a canary promotion is waiting for approval.